

The Plasmodium berghei translocon of exported proteins reveals spatiotemporal dynamics of tubular extensions
- PMID: 26219962
- PMCID: PMC4518229
- DOI: 10.1038/srep12532
The Plasmodium berghei translocon of exported proteins reveals spatiotemporal dynamics of tubular extensions
Abstract
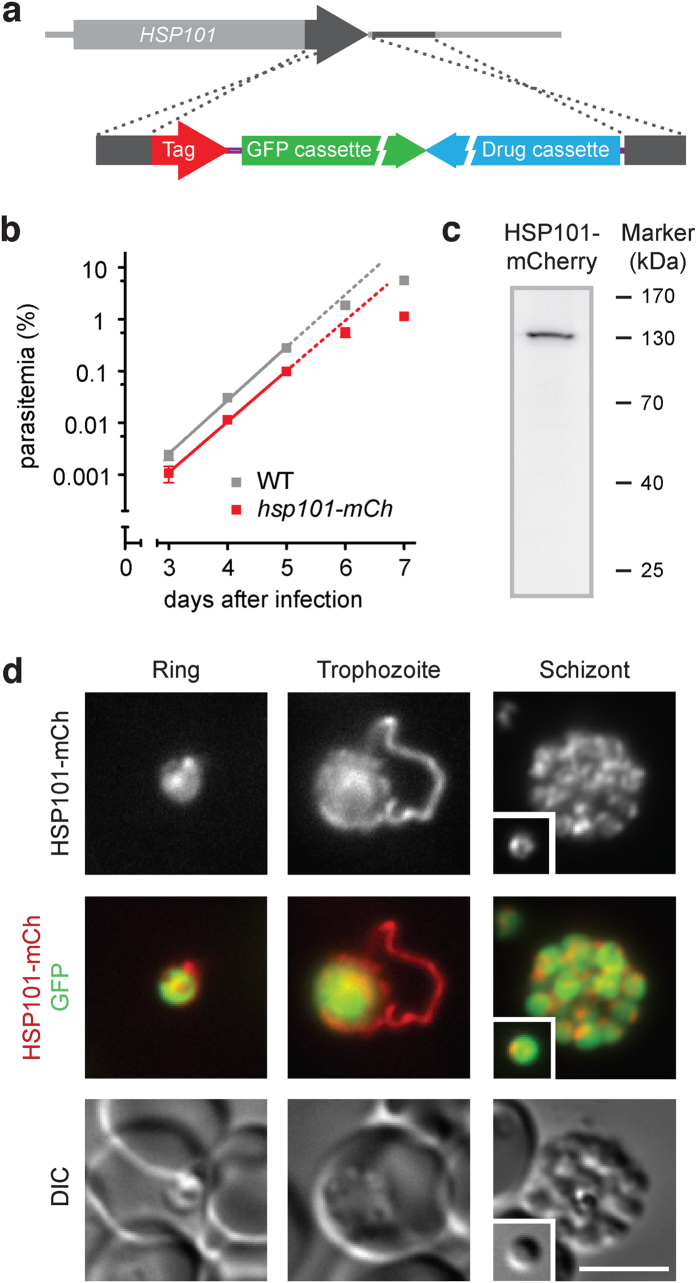
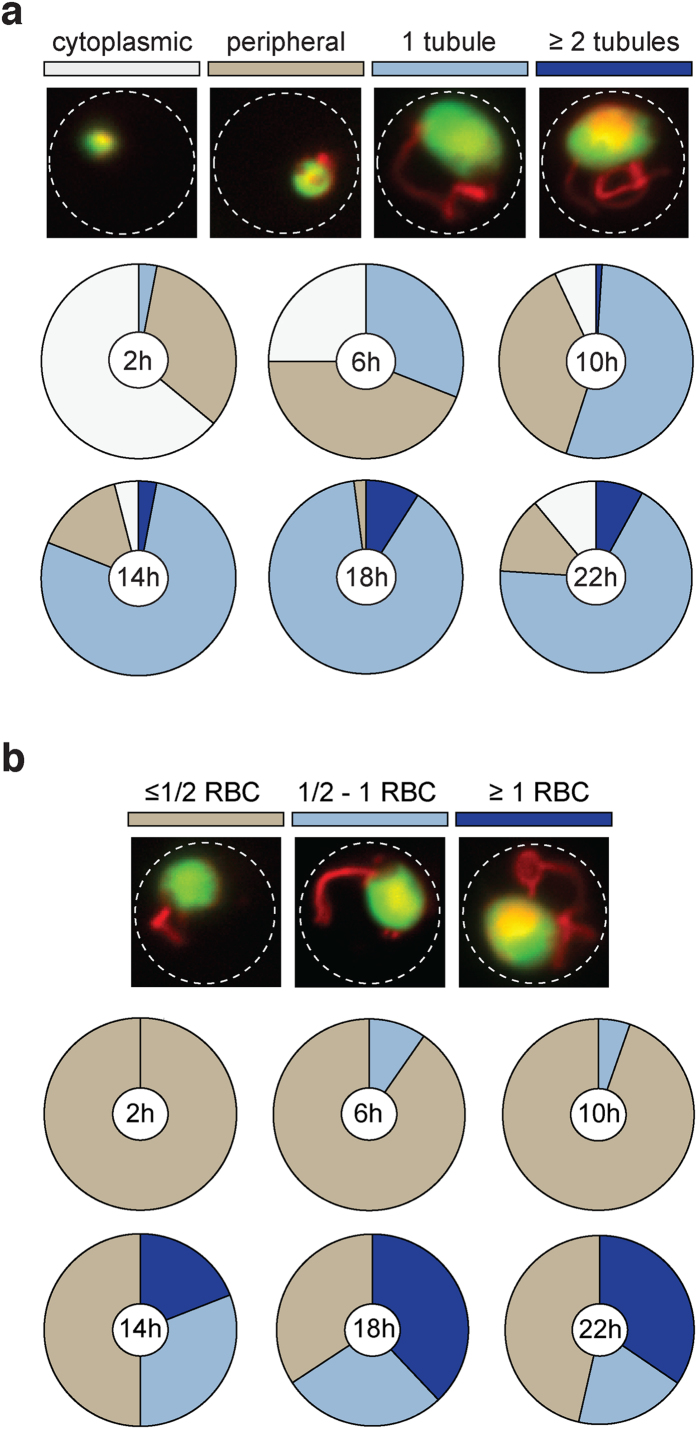
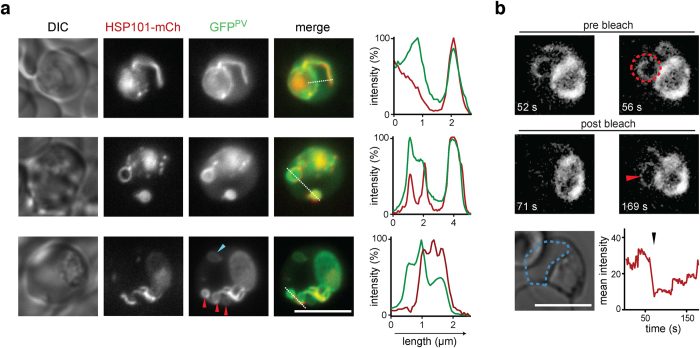
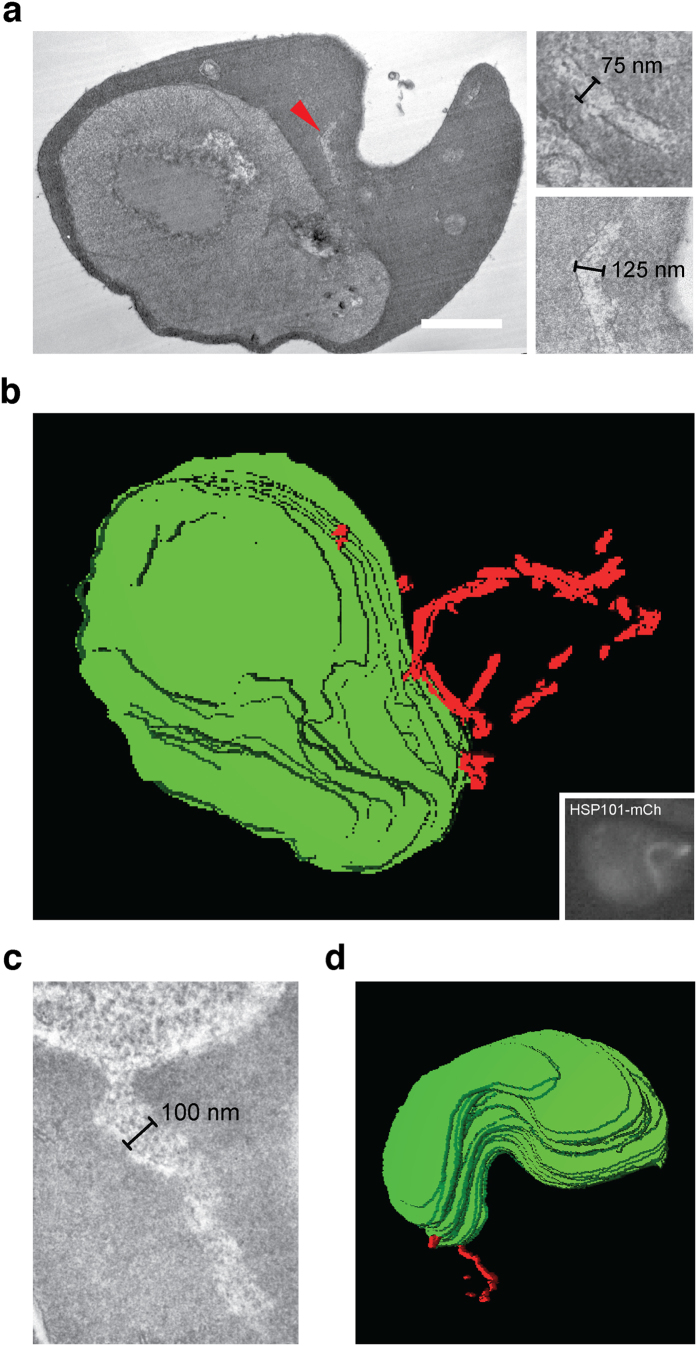
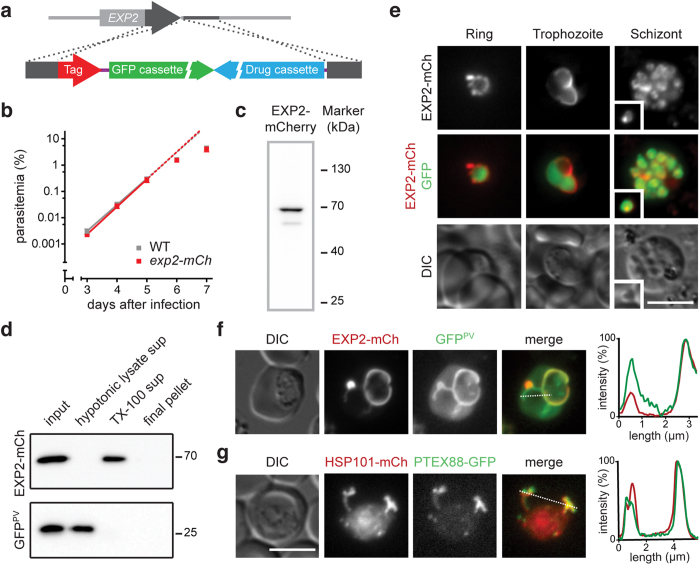
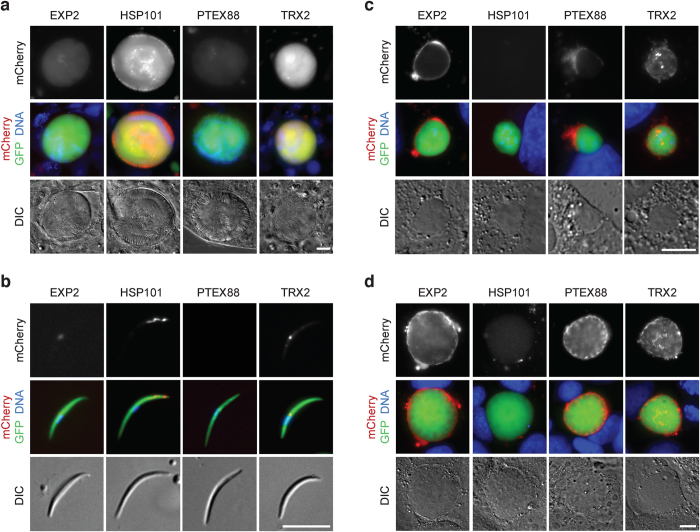
The erythrocyte is an extraordinary host cell for intracellular pathogens and requires extensive remodelling to become permissive for infection. Malaria parasites modify their host red blood cells through protein export to acquire nutrients and evade immune responses. Endogenous fluorescent tagging of three signature proteins of the Plasmodium berghei translocon of exported proteins (PTEX), heat shock protein 101, exported protein 2 (EXP2), and PTEX88, revealed motile, tubular extensions of the parasitophorous vacuole that protrude from the parasite far into the red blood cell. EXP2 displays a more prominent presence at the periphery of the parasite, consistent with its proposed role in pore formation. The tubular compartment is most prominent during trophozoite growth. Distinct spatiotemporal expression of individual PTEX components during sporogony and liver-stage development indicates additional functions and tight regulation of the PTEX translocon during parasite life cycle progression. Together, live cell imaging and correlative light and electron microscopy permitted previously unrecognized spatiotemporal and subcellular resolution of PTEX-containing tubules in murine malaria parasites. These findings further refine current models for Plasmodium-induced erythrocyte makeover.
Figures
Similar articles
-
Uncoupling the Threading and Unfoldase Actions of Plasmodium HSP101 Reveals Differences in Export between Soluble and Insoluble Proteins.mBio. 2019 Jun 4;10(3):e01106-19. doi: 10.1128/mBio.01106-19. mBio. 2019. PMID: 31164473 Free PMC article.
-
Two putative protein export regulators promote Plasmodium blood stage development in vivo.Mol Biochem Parasitol. 2013 Sep;191(1):44-52. doi: 10.1016/j.molbiopara.2013.09.003. Epub 2013 Sep 25. Mol Biochem Parasitol. 2013. PMID: 24076174
-
The PTEX Pore Component EXP2 Is Important for Intrahepatic Development during the Plasmodium Liver Stage.mBio. 2022 Dec 20;13(6):e0309622. doi: 10.1128/mbio.03096-22. Epub 2022 Nov 29. mBio. 2022. PMID: 36445080 Free PMC article.
-
Plasmodium species: master renovators of their host cells.Nat Rev Microbiol. 2016 Aug;14(8):494-507. doi: 10.1038/nrmicro.2016.79. Epub 2016 Jul 4. Nat Rev Microbiol. 2016. PMID: 27374802 Review.
-
Molecular make-up of the Plasmodium parasitophorous vacuolar membrane.Int J Med Microbiol. 2012 Oct;302(4-5):179-86. doi: 10.1016/j.ijmm.2012.07.011. Epub 2012 Aug 13. Int J Med Microbiol. 2012. PMID: 22898489 Review.
Cited by
-
Plasmodium berghei EXP-1 interacts with host Apolipoprotein H during Plasmodium liver-stage development.Proc Natl Acad Sci U S A. 2017 Feb 14;114(7):E1138-E1147. doi: 10.1073/pnas.1606419114. Epub 2017 Jan 30. Proc Natl Acad Sci U S A. 2017. PMID: 28137845 Free PMC article.
-
Uncoupling the Threading and Unfoldase Actions of Plasmodium HSP101 Reveals Differences in Export between Soluble and Insoluble Proteins.mBio. 2019 Jun 4;10(3):e01106-19. doi: 10.1128/mBio.01106-19. mBio. 2019. PMID: 31164473 Free PMC article.
-
The parasitophorous vacuole of the blood-stage malaria parasite.Nat Rev Microbiol. 2020 Jul;18(7):379-391. doi: 10.1038/s41579-019-0321-3. Epub 2020 Jan 24. Nat Rev Microbiol. 2020. PMID: 31980807 Review.
-
malERA: An updated research agenda for basic science and enabling technologies in malaria elimination and eradication.PLoS Med. 2017 Nov 30;14(11):e1002451. doi: 10.1371/journal.pmed.1002451. eCollection 2017 Nov. PLoS Med. 2017. PMID: 29190277 Free PMC article. Review.
-
Host cell remodeling by pathogens: the exomembrane system in Plasmodium-infected erythrocytes.FEMS Microbiol Rev. 2016 Sep;40(5):701-21. doi: 10.1093/femsre/fuw016. FEMS Microbiol Rev. 2016. PMID: 27587718 Free PMC article. Review.
References
-
- Haldar K., Murphy S. C., Milner D. A. & Taylor T. E. Malaria: mechanisms of erythrocytic infection and pathological correlates of severe disease. Annu. Rev. Pathol. 2, 217–249 (2007). - PubMed
-
- Elsworth B., Crabb B. S. & Gilson P. R. Protein export in malaria parasites: an update. Cell. Microbiol. 16, 355–363 (2014). - PubMed
-
- Ingmundson A., Alano P., Matuschewski K. & Silvestrini F. Feeling at home from arrival to departure: protein export and host cell remodelling during Plasmodium liver stage and gametocyte maturation. Cell. Microbiol. 16, 324–333 (2014). - PubMed
-
- Baumeister S., Winterberg M., Przyborski J. M. & Lingelbach K. The malaria parasite Plasmodium falciparum: cell biological peculiarities and nutritional consequences. Protoplasma 240, 3–12 (2010). - PubMed
Publication types
MeSH terms
Substances
LinkOut - more resources
Full Text Sources
Other Literature Sources
