. 2016 Mar;9(2):401-13.
doi: 10.1038/mi.2015.69. Epub 2015 Jul 29.

CD161(int)CD8+ T cells: a novel population of highly functional, memory CD8+ T cells enriched within the gut

Affiliations

CD161(int)CD8+ T cells: a novel population of highly functional, memory CD8+ T cells enriched within the gut

J R Fergusson et al. Mucosal Immunol. 2016 Mar.

Abstract

The C-type lectin-like receptor CD161 is expressed by lymphocytes found in human gut and liver, as well as blood, especially natural killer (NK) cells, T helper 17 (Th17) cells, and a population of unconventional T cells known as mucosal-associated invariant T (MAIT) cells. The association of high CD161 expression with innate T-cell populations including MAIT cells is established. Here we show that CD161 is also expressed, at intermediate levels, on a prominent subset of polyclonal CD8+ T cells, including antiviral populations that display a memory phenotype. These memory CD161(int)CD8+ T cells are enriched within the colon and express both CD103 and CD69, markers associated with tissue residence. Furthermore, this population was characterized by enhanced polyfunctionality, increased levels of cytotoxic mediators, and high expression of the transcription factors T-bet and eomesodermin (EOMES). Such populations were induced by novel vaccine strategies based on adenoviral vectors, currently in trial against hepatitis C virus. Thus, intermediate CD161 expression marks potent polyclonal, polyfunctional tissue-homing CD8+ T-cell populations in humans. As induction of such responses represents a major aim of T-cell prophylactic and therapeutic vaccines in viral disease and cancer, analysis of these populations could be of value in the future.


Conflict of interest statement

Disclosure: The authors declare no conflict of interest.

Figures
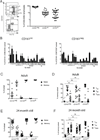
Figure 1
Figure 1
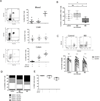
CD161 expression defines a subset of memory CD8+ T cells in adults and infant peripheral blood. A) Representative flow cytometry plots showing CD161 and CD8 (upper panel) or TCR Vα7.2 (lower panel) expression in CD8+CD3+ lymphocytes, and cumulative data for the percentage of each subset in healthy adult peripheral blood (n=28). Horizontal bars represent mean values. B) Percentage of the CD161int and memory CD161neg CD8+ T cell subsets expressing each TCR Vβ chain as determined by flow cytometry (n=10). Flow cytometric analysis of CCR7 and CD45RA expression was used to divide CD8+CD3+ lymphocytes into naïve (CCR7+CD45RA+) and memory subsets in peripheral blood from adults (C&D) and 24 month olds (E&F). Memory cells were further sub-gated into central memory (TCM; CCR7+CD45RA−), effector memory (TEM; CCR7−CD45RA−) and terminal effector memory (TEMRA; CCR7−CD45RA+) subtypes (n=16). ****p<0.0001, ns = not significant by one-way ANOVA with Tukey’s multiple comparisons test. Data are represented as mean ± SEM.
Figure 2
Figure 2
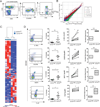
CD161int CD8+ T cells are a resident population enriched with the human colon. A) Representative flow cytometry plot and cumulative data of CD8+CD3+ lymphocytes from blood (n=10), liver (n=4) and colon (n=11) divided based upon expression of TCR Vα7.2 and CD161. B) Proportion of memory (CD45RO+) CD8+CD3+ lymphocytes from control (n=10), IBD non-inflamed (n=15) or IBD (n=7) colon biopsies expressing CD161 **p<0.01 by one-way ANOVA with Tukey’s multiple comparisons test. Box and whiskers show min to max values. C) Percentage of either CD161+ or CD161− CD8+ T cells expressing CD103 in control (n=6), IBD non-inflamed (n=16) or IBD (n=13) tissue samples, with representative flow cytometry plots. ****p<0.001 or ns = not significant by paired t-test. D) Percentage of memory CD8+ T cell populations as defined by expression of both CD161 and CD103 in control (n=6), IBD non-inflamed (n=12) or IBD (n=8) colon tissue samples. E) Proportion of each CD8+ T cell subset expressing CD69 in control colon samples (n=6). Box and whiskers show min to max values.
Figure 3
Figure 3
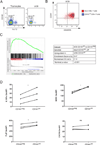
CD161int CD8+ T cells display elevated expression of IL18Rα, CXCR6, MDR1 and PLZF in peripheral blood. A) Gating strategy for sorting of CD161int and CD161neg subsets, and exclusion of naïve cells, out of CD8+CD3+ lymphocytes from PBMC for microarray analysis. B) Scatter plot of signal intensities of all mRNA probes. The signal intensities of each probe represented by a cross are shown in double logarithmic scale. Red diagonal lines define the areas of 2-fold differential signal intensities. Blue cross: unchanged genes, red cross: significantly upregulated genes (p<0.01), green cross: significantly downregulated genes (p<0.01). C) Heatmap illustrating the 952 significantly (p<0.01) differentially expressed transcripts between CD161int and CD161neg CD8+ T cells in 3 donors. Subsets clustered by one minus Pearson correlation. D) Representative flow cytometry plots for CD161 expression versus IL18Rα, MDR1, PLZF and CXCR6. Percentage positive and geoMFI for IL18Rα, MDR1, PLZF and CXCR6 for CD161int and CD161neg subsets, as determined by flow cytometry, with background subtraction of geoMFI in fluorescence minus one samples, and naïve (CCR7+CD45RA+) cells excluded. (n=7) ***p<0.001, **p<0.01, *p<0.05, ns = not significant by paired t-test. Normalised signal intensities for expression of transcripts for IL18R1, CXCR6, ABCB1 (MDR1) and ZBTB16 (PLZF) and statistical significance from mRNA microarray expression analyses after normalisation and correction for multiple testing, **p<0.01, ****p<0.0001. Floating bars show minimum and maximum values, with a line at the mean.
Figure 4
Figure 4
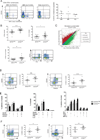
CD161int CD8+ T cells are present and pre-programmed early during development. A) Representative flow cytometry plots showing CD161 expression by CD8+CD3+ lymphocytes in thymocytes and umbilical cord blood (UCB). B) Representative flow cytometry plot showing naïve (CCR7+CD45RA+) phenotype of UCB CD161int CD8+ T cells (blue) overlaid on bulk CD8+ T lymphocytes (red). C) Gene set enrichment summary plot and data table for UCB CD161int vs CD161neg CD8+ T cell ranked genes, and enrichment of the adult CD161int CD8+ upregulated gene set. D) GeoMFI for IL18Rα, MDR1, PLZF and CXCR6 for UCB CD161int and CD161neg subsets, as determined by flow cytometry. (n=3) *p<0.05, ns = not significant by paired t-test.
Figure 5
Figure 5
CD161int CD8+ T cells express functional MDR1 in peripheral blood. A) Representative flow cytometry plot and cumulative data for MDR1 expression by peripheral blood CD8+CD3+ lymphocytes, excluding CCR7+CD45RA+ naïve cells, (n=10) ***p<0.001, *p<0.05 by one-way ANOVA with Tukey’s multiple comparisons test. Data are represented as mean ± SEM. B and C) Representative flow cytometry plots of CD8+CD3+ lymphocytes, excluding CCR7+CD45RA+ naïve cells, loaded with Rh123 on ice and either kept on ice (loading control) or incubated at 37°C in media alone (efflux) (B) or in the presence of the ABCB1 inhibitors cyclosporine A (CsA) and Verapamil (C). Cumulative data shows Rh123 efflux from each subset calculated as per Materials & Methods, relative to the fluorescence of dye loaded (loading control). ****p<0.0001 by one-way ANOVA with Tukey’s multiple comparisons test (n=12). (B). or the percentage of each subset having effluxed Rh123 ****p<0.0001, *p<0.05, ns = not significant by two-way ANOVA with Dunnett’s multiple comparisons test, compared to the efflux sample (n=8) (C). Data are represented as mean ± SEM.
Figure 6
Figure 6
CD161int CD8+ T cells are polyfunctional anti-viral cells. A) Representative flow cytometry plots showing CD161 expression by CD8+ T cells specific for epitopes from CMV (NLVPMVATV), EBV (GLCTVAML) and influenza virus (FLU; GILGFVFTL) as distinguished by dextramer staining of adult peripheral blood, and cumulative data for percentage of anti-viral subset expressing CD161. Horizontal bars represent mean values, (n=5). B) Percentage of CD161*** or CD161int subsets expressing IFNγ, IL-2 or a combination of both upon stimulation with PMA + ionomycin (n=18). Representative flow cyometry plots for cytokine expression in CD8+CD3+ PBMC, excluding CCR7+CD45RA+ naïve cells, are shown. C) Scatter plot of signal intensities of all mRNA probes in stimulated (y axis) vs. unstimulated (x axis) CD161int CD8+ T cells from peripheral blood. The signal intensities of each probe represented by a cross are shown in double logarithmic scale. Red diagonal lines define the areas of 2-fold differential signal intensities. Blue cross: unchanged genes, red cross: significantly upregulated genes (p<0.01), green cross: significantly downregulated genes (p<0.01). D) Percentage of CD161int and CD161 CD8+ T cells expressing cytokine (IL-2, IFNγ, TNFα, MIP1β) and cytotoxic mediators (GzmB; Granzyme B, Perforin and CD107) singly or in combination as detected by Cytometry by Time-of-Flight (CyTOF) (n=4). E) Representative flow cytometry plots and cumulative data for percentage of CD8+CD3+ PBMC, excluding CCR7+CD45RA+ naïve cells, expressing cytotoxic effectors granzyme B and perforin. F) Percentage of cells expressing EOMES (upper panel) or T-bet (lower panel) in memory CD8+CD3+ lymphocytes with representative flow cytometry plots. ****p<0.0001, ***p<0.001, **p<0.01, *p<0.05, ns = not significant by paired t-test. Data are represented as mean ± SEM.
Figure 7
Figure 7
CD161int associated phenotype in anti-viral CD8+ T cells induced by vaccination. CD8+ T cells targeting epitopes from Hepatitis C virus, induced by a novel T cell vaccine strategy based on adenoviral vectors were identified from PBMC using MHC class I multimers. A) Percentage of the anti-viral and bulk CD8+ T cell populations expressing CD161. GeoMFI for granzyme B (B) or perforin (C) of anti-viral populations either CD161int or CD161, as determined by flow cytometry. (n=10) **p<0.01 and ns = not significant by paired t-test. Data are represented as mean ± SEM.

Similar articles

Cited by

References

    1. Walker LJ, et al. Human MAIT and CD8 alpha alpha cells develop from a pool of type-17 precommitted CD8+ T cells. Blood. 2012;119:422–433. - PMC - PubMed
    1. Gebhardt T, et al. Memory T cells in nonlymphoid tissue that provide enhanced local immunity during infection with herpes simplex virus. Nat. Immunol. 2009;10:524–530. - PubMed
    1. Jiang X, et al. Skin infection generates non-migratory memory CD8+ T(RM) cells providing global skin immunity. Nature. 2012;483:227–231. - PMC - PubMed
    1. Masopust D, Vezys V, Wherry EJ, Barber DL, Ahmed R. Cutting Edge: Gut Microenvironment Promotes Differentiation of a Unique Memory CD8 T Cell Population. J. Immunol. 2006;176:2079–2083. - PubMed
    1. Lanier LL, Chang C, Phillips JH. Human NKRP1A. A disulfide-linked homodimer of the C-type lectin superfamily expressed by a subset of NK and T lymphocytes. J. Immunol. 1994;153:2417–2428. - PubMed

Publication types

MeSH terms