. 2015 Sep 18;43(16):7984-8001.
doi: 10.1093/nar/gkv762. Epub 2015 Jul 28.

Identification of siRNA delivery enhancers by a chemical library screen

Affiliations

Identification of siRNA delivery enhancers by a chemical library screen

Jerome Gilleron et al. Nucleic Acids Res. .

Abstract

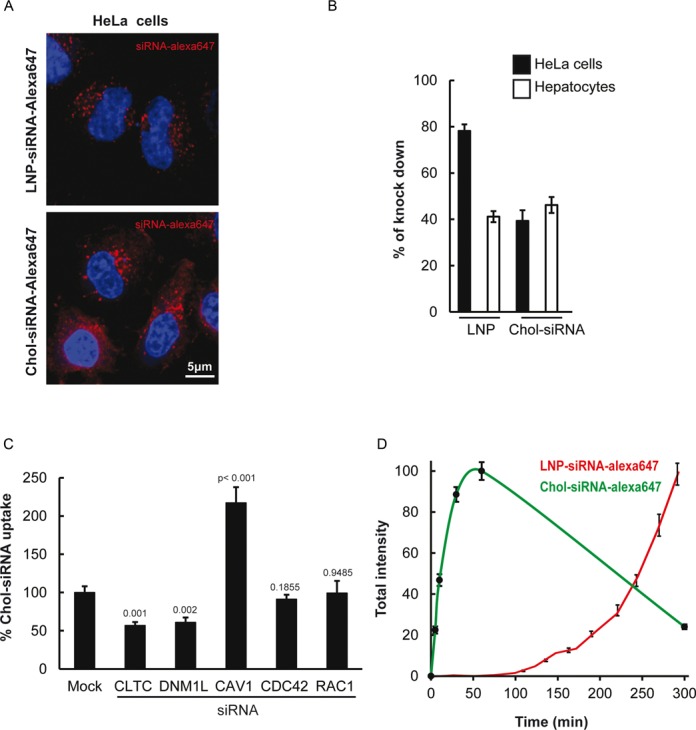
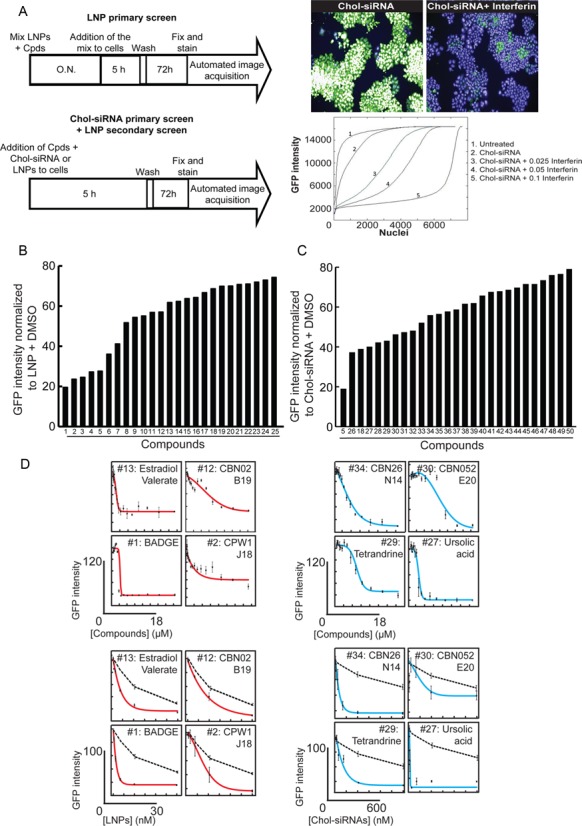
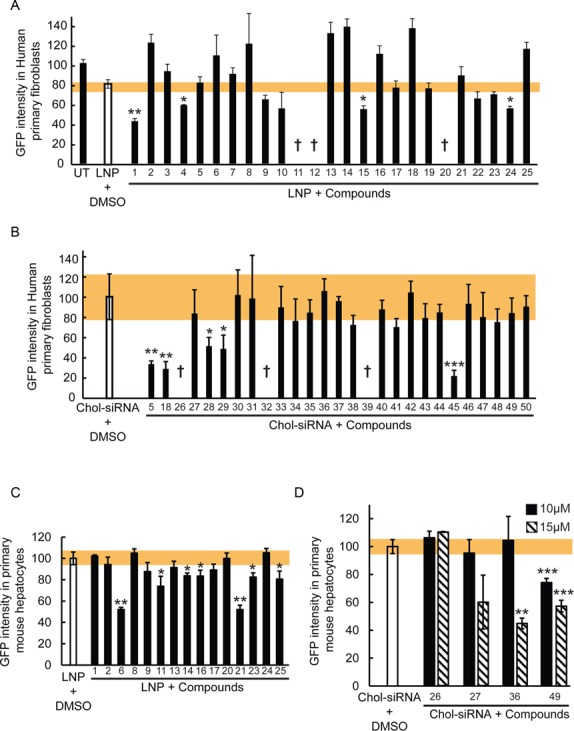
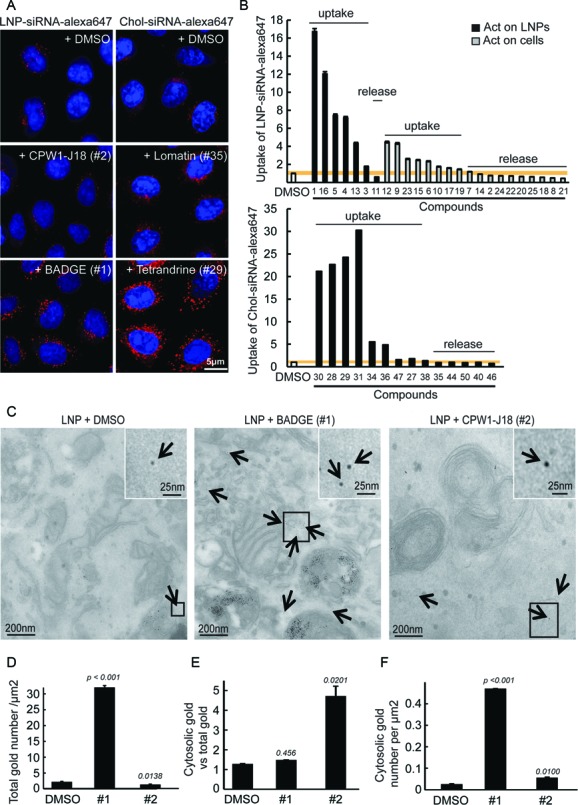
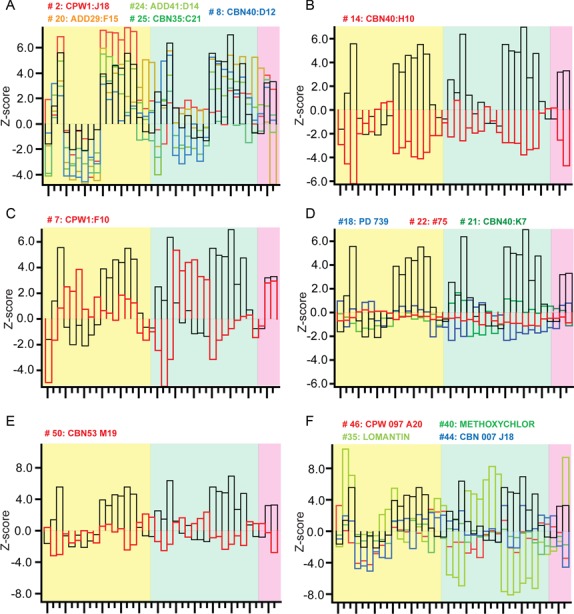
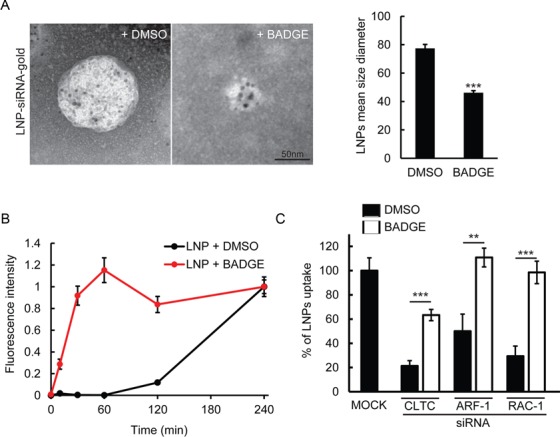
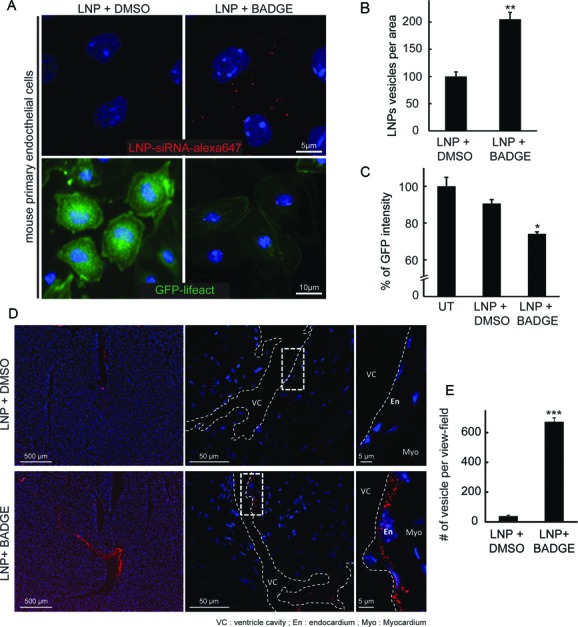
Most delivery systems for small interfering RNA therapeutics depend on endocytosis and release from endo-lysosomal compartments. One approach to improve delivery is to identify small molecules enhancing these steps. It is unclear to what extent such enhancers can be universally applied to different delivery systems and cell types. Here, we performed a compound library screen on two well-established siRNA delivery systems, lipid nanoparticles and cholesterol conjugated-siRNAs. We identified fifty-one enhancers improving gene silencing 2-5 fold. Strikingly, most enhancers displayed specificity for one delivery system only. By a combination of quantitative fluorescence and electron microscopy we found that the enhancers substantially differed in their mechanism of action, increasing either endocytic uptake or release of siRNAs from endosomes. Furthermore, they acted either on the delivery system itself or the cell, by modulating the endocytic system via distinct mechanisms. Interestingly, several compounds displayed activity on different cell types. As proof of principle, we showed that one compound enhanced siRNA delivery in primary endothelial cells in vitro and in the endocardium in the mouse heart. This study suggests that a pharmacological approach can improve the delivery of siRNAs in a system-specific fashion, by exploiting distinct mechanisms and acting upon multiple cell types.


Figures

Figure 1.
Figure 1.
LNPs and cholesterol conjugates differ in uptake mechanism. (A) Images of HeLa cells after incubation with LNP-siRNA-alexa647 (top panels) or cholesterol conjugated-siRNA (Chol-siRNA)-alexa647 (bottom panels) for 5 h and 1 h, respectively. (B) Quantification of the percentage of GFP downregulation in HeLa GFP-expressing cells and primary mouse hepatocytes expressing Lifeact-GFP exposed to 40 nM of LNP-siRNA and 1 μM of Chol-siRNA (n = 3, mean ± SEM). (C) Chol-siRNAs-alexa647 uptake in HeLa cells after silencing of dynamin (DNM1L), clathrin light chain (CLTC), Caveolin (CAV1), CDC42 (for clathrin-independent endocytosis)) and RAC1 (Macropinocytosis). Mean ± SEM, n = 3, P-value relative to control. (D) Uptake kinetics of LNP-siRNA-alexa647 (40 nM, red curve) compared to Chol-siRNA-alexa647 (250 nM, green curve).
Figure 2.
Figure 2.
Enhancers of gene silencing identified by high throughput compound library screen for both delivery systems. (A) The workflow for the chemical screen (top panel) includes a simple image-based analysis readout (bottom left panels) by segmenting nuclei and analysing the distribution of the GFP intensity per nuclei. The doses for both delivery systems were selected such that potential improvements in activity could be detected over a wide range as confirmed by addition of increasing doses of interferin (bottom right panel). (B) GFP intensity in HeLa GFP cells transfected with LNPs and individual compounds identified as hits ([LNP-siRNA] = 5 nM and [Compounds] = 10 μM). The compounds structures can be found in Supplementary Figure S1A–C. (C) GFP intensity in HeLa GFP cells transfected with Chol-siRNA and individual compounds identified as hits ([Chol-siRNA] = 250 nM and [Compounds] = 10 μM). The compounds structures can be found in Supplementary Figure S1A–C. (D) IC50 from selected identified compounds. In the top panels, the concentration of siRNAs was fixed to 5 nM for LNPs (red lines) and to 250 nM for cholesterol-conjugates (blue lines), and the concentration of the compounds was increasing from 0 to 18 μM. In the bottom panels the concentration of the compounds was fixed to 10 μM, and those of the delivery systems were increasing from 0 to 30 nM for LNPs (red lines) and from 0 to 600 nM for cholesterol conjugate (blue lines). The black dotted lines represents the respective DMSO treated delivery systems The toxicity at various doses of compounds was determined based on cell numbers (Supplementary Figure S4) and could be considered as not very significant for all the compounds at 10 μM.
Figure 3.
Figure 3.
Various library compounds improve LNP- and cholesterol conjugate-based siRNA delivery and silencing. (A) Percentage of GFP intensity in human primary fibroblasts expressing Rab5-GFP after LNP-based silencing of GFP treated with the identified compound hits ([LNP-siRNA] = 5 nM and [Compounds] = 10 μM). UT = untreated, † = cytotoxic effect. Mean ± SEM, n = 3 (*P-value < 0.05, **P < 0.01). The toxicity was determined based on cell numbers (Supplementary Figure S2C). The yellow bar represents the SEM of the DMSO treated condition. (B) Percentage of GFP intensity in human primary fibroblasts expressing Rab5-GFP after Chol-siRNA-based silencing of GFP treated with the identified hits ([Chol-siRNA] = 250 nM and [Compounds] = 10 μM). † = cytotoxic effect. Mean ± SEM, n = 3 (*P-value < 0.05, **P < 0.01, ***P-value < 0.001). The toxicity was determined based on cell numbers (Supplementary Figure S2D). The yellow bar represents the SEM of the DMSO treated condition. (C) Percentage of GFP intensity in mouse primary hepatocytes expressing Lifeact-GFP after LNP-based silencing of GFP treated with the identified hits ([LNP-siRNA] = 5 nM and [Compounds] = 10 μM). Mean ± SEM, n = 2 (*P-value < 0.05, **P < 0.01). The yellow bar represents the SEM of the DMSO treated condition. (D) Percentage of GFP intensity in mouse primary hepatocytes expressing Lifeact-GFP after Chol-siRNA-based silencing of GFP treated with 10 μM (black bars) or 15 μM (striped bars) of the identified hits. Mean ± SEM, n = 2 (**P-value < 0.01, ***P < 0.001). The yellow bar represents the SEM of the DMSO treated condition.
Figure 4.
Figure 4.
Mechanism of action of the compounds on LNP- and cholesterol conjugate-based siRNA delivery and silencing. (A) Images illustrating the uptake of LNP-siRNA-alexa647 (40 nM, 5 h incubation, left panel) and Chol-siRNA-alexa647 (250 nM, 5h incubation, right panel) treated with DMSO (top panels) or with the compounds (10 μM) that increased the uptake (bottom panels: BADGE and Tetrandrine) or not (middle panels: CPW1-J18 and Lomatin) in HeLa cells. (B) Quantitative analysis of LNP-siRNA-alexa647 (40 nM, 5 h incubation, top panel) and Chol-siRNA-alexa647 (250 nM, 5h incubation, bottom panel) uptake in cells treated with DMSO or compounds (10 μM). Compounds acting on the delivery systems are represented with black bars and those acting on the cells with gray bars. The compounds structure can be found in Supplementary Figure S1A–C. (C) LNP-siRNA-gold detected in HeLa cells in vitro, by EM ([LNP = 40 nM]; [compounds] = 10 μM). siRNA-gold were detected in the cytosol (arrows) or within several endocytic compartments. Magnified images (insets) permit appreciation of the cytosolic localization of siRNA-gold. (D) Automated quantification of the total number of siRNA-gold (representing the uptake) found per μm2 of cell section. Mean ± SEM, n = 3 (*P-value < 0.05, ***P < 0.001). (E) Semi-automated quantification of the ratio between the number of cytosolic siRNA-gold and the total number of siRNA-gold internalized (representing the percentage of siRNA escape). Mean ± SEM, n = 3 (*P-value < 0.05). (F) Semi-automated quantification of the number of cytosolic siRNA-gold per μm2 of cells. Mean ± SEM, n = 3 (*P-value < 0.05, ***P-value < 0.001).
Figure 5.
Figure 5.
Comparison of multi-parametric profiles of the enhancers on EGF and transferrin endocytosis. HeLa cells were incubated with the enhancers (10 μM), allowed to internalize fluorescently labeled EGF and transferrin, imaged and analyzed as described (44,64). LNP enhancers had profiles correlated (A), anti-correlated (B) or not correlated (C) with the endocytic profile of hydroxychloroquine (Black bars) or (D) having very modest effects on endocytosis. The profiles of Chol-siRNA enhancers were anti-correlated (E) or not correlated (F) with hydroxychloroquine (Black bars). The yellow, green and pink background color represents the EGF parameters, the transferrin parameters and co-localizations parameters, respectively. The detailed list of parameters is presented in Supplementary Figure S7.
Figure 6.
Figure 6.
BADGE reduces the size of LNPs leading to increased uptake kinetics and exploitation of entry routes. (A) Visualization of LNP-siRNA-gold by electron microscopy after incubation with DMSO or BADGE (10 μM). LNPs mean size diameter quantification (right panel). Mean ± SEM, n = 3 (***P-value < 0.001). (B) Uptake kinetics of LNP-siRNA-alexa647 (40 nM) treated with DMSO (black curve) or BADGE (red curve, 10 μM). (C) Percentage of uptake of LNP-siRNA-alexa647 treated with DMSO (black columns) or BADGE (white columns) in HeLa cells after silencing of key regulators of CME (CLTC) and Macropinocytosis (ARF-1, RAC1) ([LNP = 40 nM]; [Compound] = 10 μM). Mean ± SEM, n = 3 (**P-value < 0.01, ***P-value < 0.001).
Figure 7.
Figure 7.
BADGE improves LNP-based siRNA delivery in endothelial cells in vitro and in vivo. (A) Uptake of LNP-siRNA-alexa647 (40 nM, 5 h incubation, top panels) and GFP downregulation (40 nM, 72 h after transfection, bottom panels) after treatment with 10 μM of DMSO (left panels) or BADGE (right panels) in mouse primary endothelial cells and primary endothelial cells from GFP-lifeact mice. (B) Quantification of the number of siRNA-alexa647 positive vesicle per area in mouse primary endothelial cells. Mean ± SEM, n = 3 (**P-value < 0.01). (C) Percentage of GFP intensity in primary endothelial cells isolated from GFP-lifeact mice after 72 h of transfection with LNP-siRNA treated with DMSO or BADGE. Mean ± SEM, n = 3 (*P-value < 0.05). (D) Uptake of LNP-siRNA-alexa647 treated with DMSO (top panels) or BADGE (bottom panels) injected into the heart of mice immediately after sacrifice and incubated for 10 min ([LNP = 40 nM]; [Compound] = 10 μM). Increasing magnifications evidenced the localization of the signal in the endocardium cell layer (En). VC = ventricle cavity, Myo = myocardium. (E) Quantitative analysis of the number of LNP-siRNA-alexa647 per view field in vivo after treatment with DMSO or BADGE. Mean ± SEM, n = 3 (***P-value < 0.001).

Similar articles

Cited by

References

    1. Sliva K., Schnierle B.S. Selective gene silencing by viral delivery of short hairpin RNA. Virol. J. 2010;7:248–258. - PMC - PubMed
    1. Buyens K., De Smedt S.C., Braeckmans K., Demeester J., Peeters L., van Grunsven L.A., de Mollerat du Jeu X., Sawant R., Torchilin V., Farkasova K., et al. Liposome based systems for systemic siRNA delivery: stability in blood sets the requirements for optimal carrier design. J. Control. Release. 2012;158:362–370. - PubMed
    1. Castillo B., Bromberg L., Lopez X., Badillo V., Gonzalez Feliciano J.A., Gonzalez C.I., Hatton T.A., Barletta G. Intracellular Delivery of siRNA by Polycationic Superparamagnetic Nanoparticles. J. Drug Deliv. 2012;2012:218940–218951. - PMC - PubMed
    1. Lopez-Davila V., Seifalian A.M., Loizidou M. Organic nanocarriers for cancer drug delivery. Curr. Opin. Pharmacol. 2012;12:414–419. - PubMed
    1. Nair J., Willoughby J., Chan A., Charisse K., Alam R.M., Wang Q., Hoekstra M., Kandasamy P., Kel'in A.V., Milstein S., et al. Multivalent N-Acetylgalactosamine-Conjugated siRNA Localizes in Hepatocytes and Elicits Robust RNAi-mediated Gene Silencing. J. Am. Chem. Soc. 2014;136:16958–16961. - PubMed

Publication types