. 2015 Jul 29;16(1):556.
doi: 10.1186/s12864-015-1733-8.

Network analysis of temporal functionalities of the gut induced by perturbations in new-born piglets

Affiliations

Network analysis of temporal functionalities of the gut induced by perturbations in new-born piglets

Nirupama Benis et al. BMC Genomics. .

Abstract

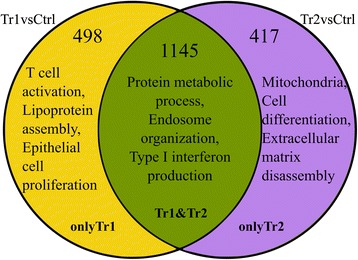
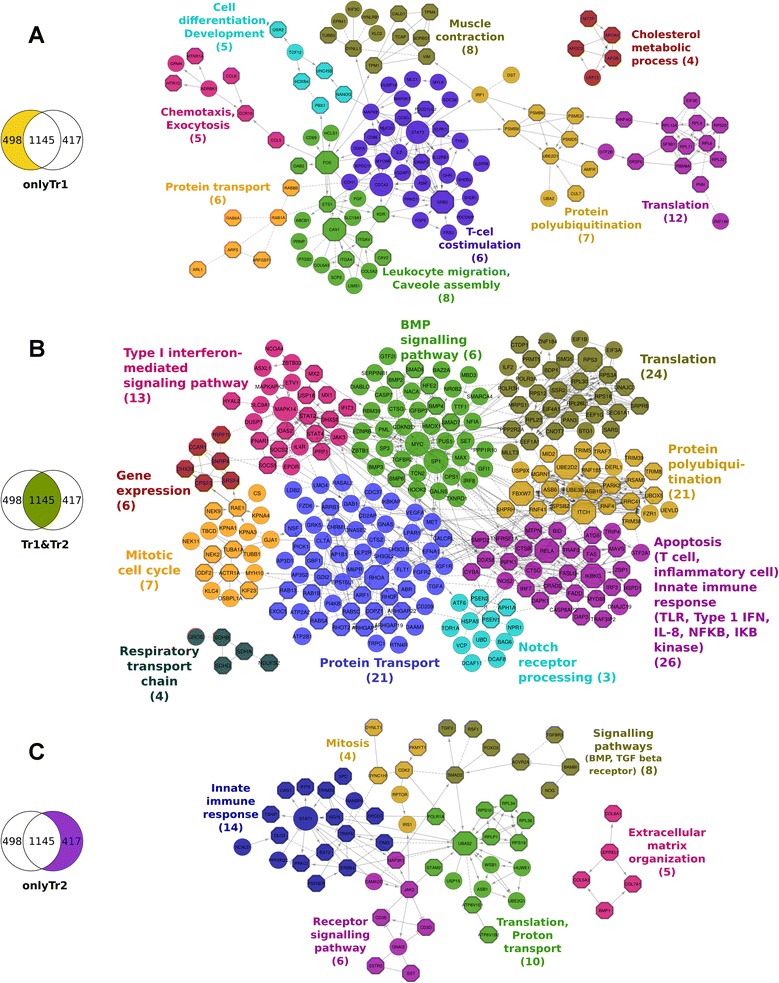
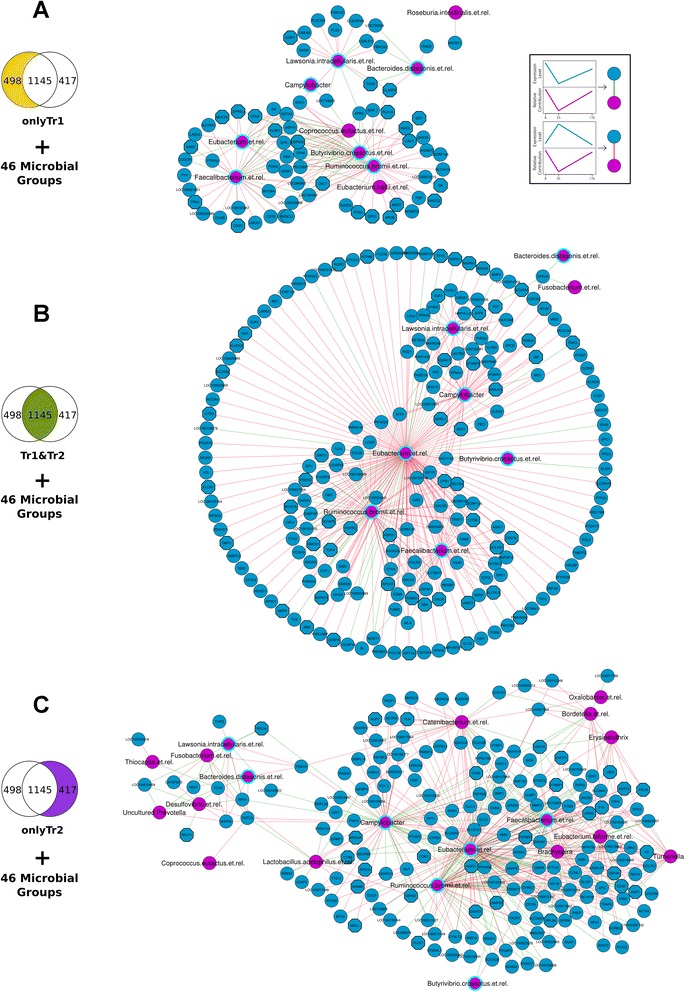
Background: Evidence is accumulating that perturbation of early life microbial colonization of the gut induces long-lasting adverse health effects in individuals. Understanding the mechanisms behind these effects will facilitate modulation of intestinal health. The objective of this study was to identify biological processes involved in these long lasting effects and the (molecular) factors that regulate them. We used an antibiotic and the same antibiotic in combination with stress on piglets as an early life perturbation. Then we used host gene expression data from the gut (jejunum) tissue and community-scale analysis of gut microbiota from the same location of the gut, at three different time-points to gauge the reaction to the perturbation. We analysed the data by a new combination of existing tools. First, we analysed the data in two dimensions, treatment and time, with quadratic regression analysis. Then we applied network-based data integration approaches to find correlations between host gene expression and the resident microbial species.

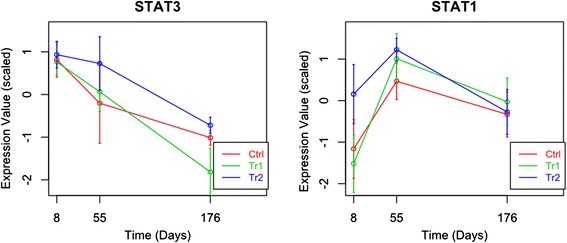
Results: The use of a new combination of data analysis tools allowed us to identify significant long-lasting differences in jejunal gene expression patterns resulting from the early life perturbations. In addition, we were able to identify potential key gene regulators (hubs) for these long-lasting effects. Furthermore, data integration also showed that there are a handful of bacterial groups that were associated with temporal changes in gene expression.

Conclusion: The applied systems-biology approach allowed us to take the first steps in unravelling biological processes involved in long lasting effects in the gut due to early life perturbations. The observed data are consistent with the hypothesis that these long lasting effects are due to differences in the programming of the gut immune system as induced by the temporary early life changes in the composition and/or diversity of microbiota in the gut.


Figures

Fig. 1
Fig. 1
Summary of GO Enrichment analysis results from topGO. Biological processes (Gene Ontology terms) are given based on manual interpretation of the most significantly enriched terms obtained with topGO. The two circles represent the Tr1vsCtrl and Tr2vsCtrl comparisons. Numbers denote the number of input genes in topGO, these genes are have significantly different time profiles in the treatment vs the control groups. In the yellow, green and purple fields enriched processes are given for OnlyTr1, Tr1&Tr2, and OnlyTr2, respectively
Fig. 2
Fig. 2
Functional Interaction networks (a, b, c). Genes are represented as nodes in the networks, all these genes have time profiles that are significantly different in the treatment than in the control. The edges represent interactions between genes as determined by Reactome. Arrows represent directed interactions, bar-headed arrows indicate inhibition reactions. Dotted lines indicate predicted relationships. Network A was built from OnlyTr1 genes, network B from the common or overlapping genes (Tr1&Tr2) and network C from OnlyTr2 genes. Colours in the network represent the network segmentation into modules. The text denotes the GO term that was most enriched for the genes in that module and the number in brackets denotes the number of genes associated with that particular GO term. Octagonal nodes are related to the GO term at the set p-value threshold. The nodes with a larger diameter are hubs in the networks. High resolution images of the individual networks are given as Additional file 5: Figure S5, Additional file 6: Figure S6 and Additional file 7: Figure S7. The nodes of the Tr1&Tr2 network were rearranged for better visualisation of the modules; the network in the original structure is in Additional file 8: Fig. 4 Additional file 9: Fig. 5
Fig. 3
Fig. 3
Gene expression patterns of important hubs. In Fig. 3 each graph depicts the temporal expression pattern of a single gene. These temporal changes are shown under three different conditions: Ctrl (red line), Tr1 (green line), and Tr2 (blue line). The x-axis indicates the time in days. The expression values (y-axis) are scaled such that the average expression of each gene is 0 and the standard deviation is 1
Fig. 4
Fig. 4
Correlation networks of changes in gene expression patterns and microbiota composition: Blue nodes represent genes and the pink ones represent bacterial groups; pink nodes with a cyan boundary are nodes common in the three networks. The edges represent positive (green) and negative (red) correlation between a gene and a bacterial group. Networks (a), (b) and (c) were built by correlating the gene lists OnlyTr1, Tr1&Tr2 and OnlyTr2 respectively with the 46 microbial groups resulting from the regression analysis. All the nodes (bacterial groups and genes) have a significantly different expression profile in time or treatment compared to the control. High resolution images of the individual networks are given as Additional file 10: Figure S10, Additional file 8: Figure S11 and Additional file 12: Figure S12

Similar articles

Cited by

References

    1. Foliaki S, Pearce N, Björkstén B, Mallol J, Montefort S, von Mutius E. Antibiotic use in infancy and symptoms of asthma, rhinoconjunctivitis, and eczema in children 6 and 7 years old: International Study of Asthma and Allergies in Childhood Phase III. J Allergy Clin Immunol. 2009;124:982–9. doi: 10.1016/j.jaci.2009.08.017. - DOI - PubMed
    1. Hoskin-Parr L, Teyhan A, Blocker A, Henderson AJW. Antibiotic exposure in the first two years of life and development of asthma and other allergic diseases by 7.5 yr: a dose-dependent relationship. Pediatr Allergy Immunol. 2013;24:762–71. doi: 10.1111/pai.12153. - DOI - PMC - PubMed
    1. Relman DA. The human microbiome: ecosystem resilience and health. Nutr Rev. 2012;70:S2–9. doi: 10.1111/j.1753-4887.2012.00489.x. - DOI - PMC - PubMed
    1. Hooper LV. Bacterial contributions to mammalian gut development. Trends Microbiol. 2004;12(3):129–34. doi: 10.1016/j.tim.2004.01.001. - DOI - PubMed
    1. O’Hara AM, Shanahan F. The gut flora as a forgotten organ. EMBO Rep. 2006;7:655–746. doi: 10.1038/sj.embor.7400738. - DOI - PMC - PubMed

Publication types

Substances