. 2015 Jul 30:3:48.
doi: 10.1186/s40478-015-0225-z.

Tuberous sclerosis complex neuropathology requires glutamate-cysteine ligase

Affiliations

Tuberous sclerosis complex neuropathology requires glutamate-cysteine ligase

Anna R Malik et al. Acta Neuropathol Commun. .

Abstract

Introduction: Tuberous sclerosis complex (TSC) is a genetic disease resulting from mutation in TSC1 or TSC2 and subsequent hyperactivation of mammalian Target of Rapamycin (mTOR). Common TSC features include brain lesions, such as cortical tubers and subependymal giant cell astrocytomas (SEGAs). However, the current treatment with mTOR inhibitors has critical limitations. We aimed to identify new targets for TSC pharmacotherapy.

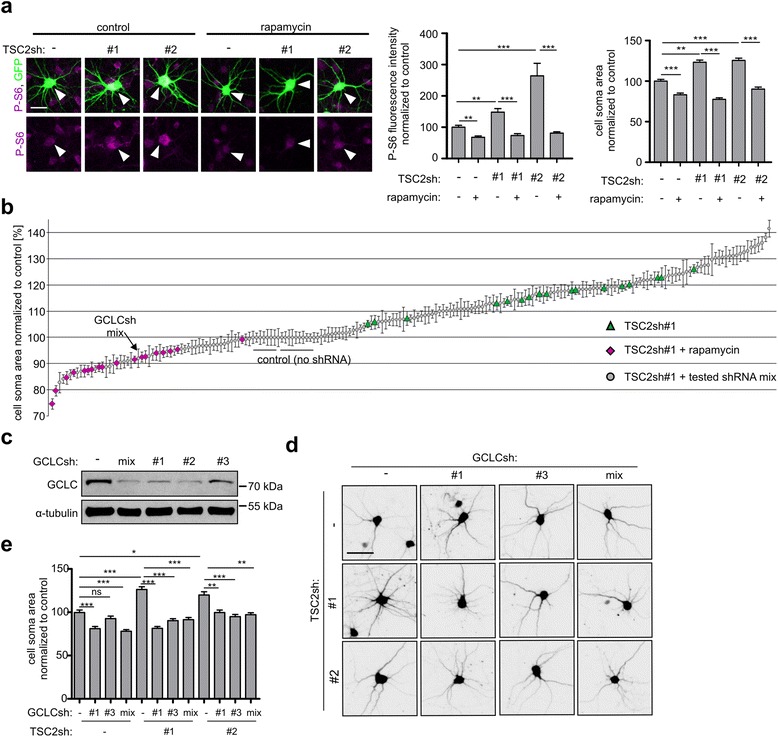
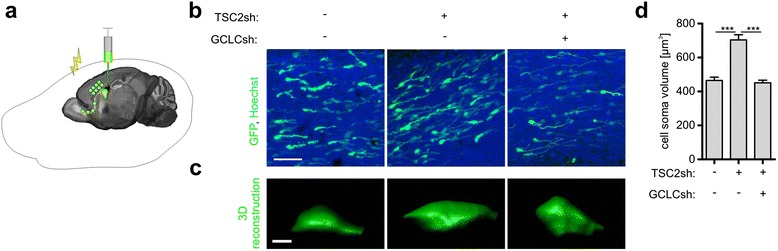
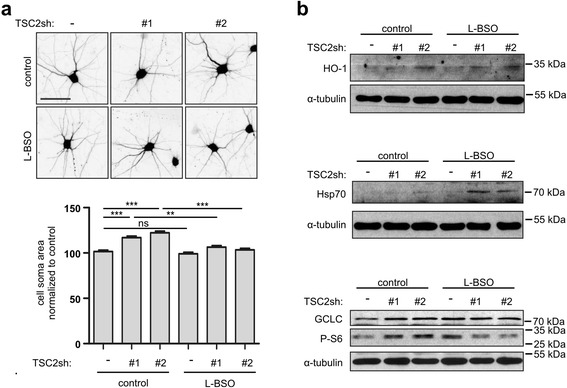
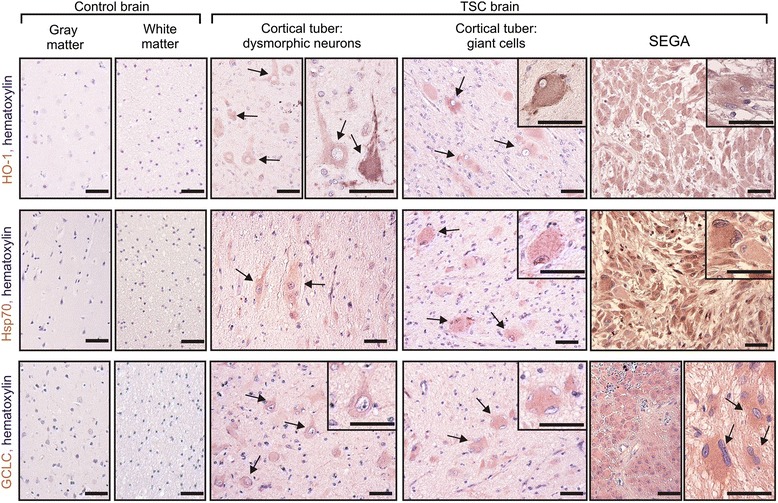
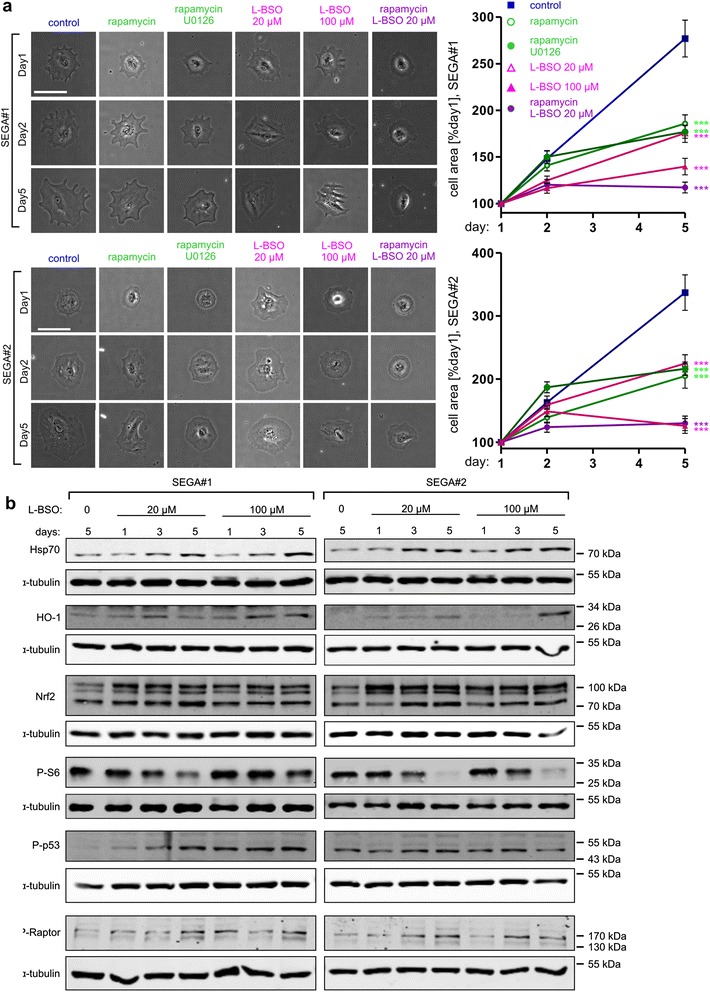
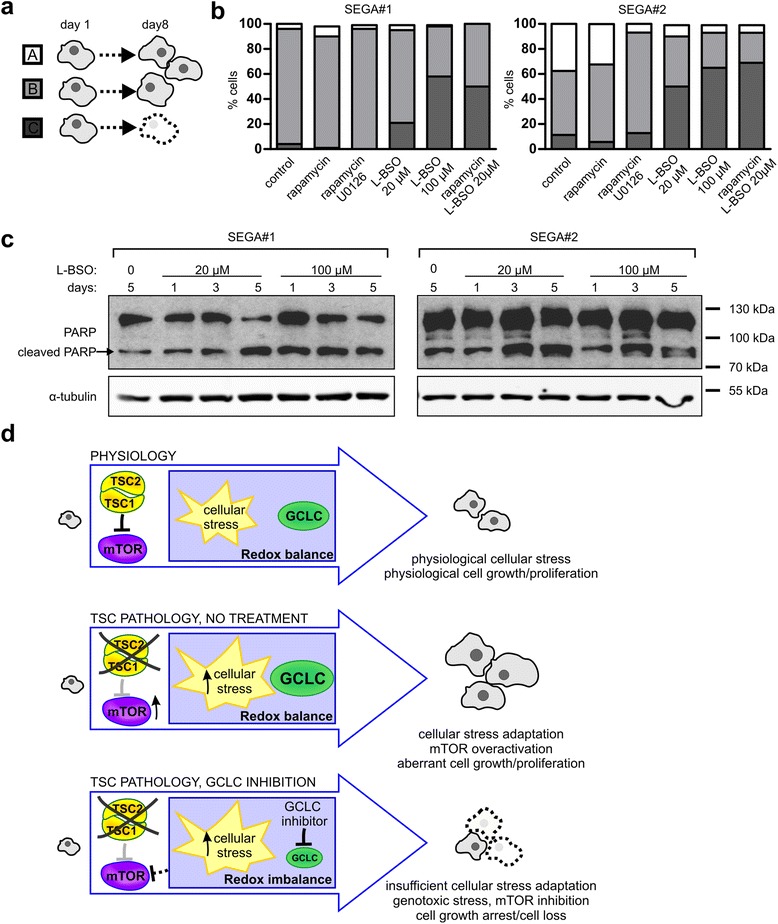
Results: The results of our shRNA screen point to glutamate-cysteine ligase catalytic subunit (GCLC), a key enzyme in glutathione synthesis, as a contributor to TSC-related phenotype. GCLC inhibition increased cellular stress and reduced mTOR hyperactivity in TSC2-depleted neurons and SEGA-derived cells. Moreover, patients' brain tubers showed elevated GCLC and stress markers expression. Finally, GCLC inhibition led to growth arrest and death of SEGA-derived cells.

Conclusions: We describe GCLC as a part of redox adaptation in TSC, needed for overgrowth and survival of mutant cells, and provide a potential novel target for SEGA treatment.


Figures

Fig. 1
Fig. 1
GCLC knockdown reverses the phenotype of model dysmorphic neurons. a TSC2 knockdown in rat cortical neurons as a model of TSC-related dysmorphic neurons. Neurons were transfected with empty pSuper vector, TSC2sh#1, or sh#2 together with GFP. Next, neurons were treated with 20 nM rapamycin or DMSO (control), fixed, and immunostained for P-S6. Representative images, results of analysis of P-S6 intensity, and neuron soma area. Scale bar: 25 μm. Plots represent mean +/−SEM. **p < 0.01, ***p < 0.001 in Kruskal-Wallis with Dunn’s post-hoc test. Sample sizes for experimental groups are provided in Supplementary materials and methods (Additional file 1). For additional results of TSC2sh validation, see Additional file 3: Figure S1. b Results of analysis of neuronal soma area from screening experiments. Each point represents mean +/− SEM obtained from two independent experiments. For more details see Additional file 2: Table S1 and Additional file 3: Table S2. c Western blot analysis of GCLC level in rat cortical neurons 4 days after nucleofection with empty pSuper vector, GCLCsh-mix used in the screening experiments or individual GCLCsh#1, sh#2, and sh#3. α-tubulin is shown as a loading control. d Representative images of rat cortical neurons after TSC2 knockdown with use of 2 different shRNAs and simultaneous GCLC knockdown with use of mixed shRNAs (as in the screen) or 2 individual shRNAs. GFP-encoding plasmid was co-transfected for visualization of modified neurons. Scale bar: 50 μm. e Neuronal soma area of rat cortical neurons after TSC2 and GCLC knockdown. Plot represents mean +/−SEM. ns- not significant, *p < 0.05, **p < 0.01, ***p < 0.001 in Kruskal-Wallis with Dunn’s post-hoc test. Sample sizes for experimental groups are provided in Supplementary materials and methods (Additional file 1)
Fig. 2
Fig. 2
GCLCsh blocks aberrant growth in TSC in vivo model. a Scheme of in vivo electroporation. b Representative images of cells in rostral migratory stream obtained in in vivo experiments. Newborn rats were electroporated with pSuper vector or TSC2sh#2 together with pSuper or GCLCsh#1. Plasmid encoding GFP was used to visualize modified cells. Scale bar: 50 μm. c Exemplary 3D reconstructions of GFP-positive cells in rostral migratory stream. Scale bar: 3 μm. d Quantification of cell soma volume of cells migrating in the rostral migratory stream. Plot represents mean +/−SEM. ***p < 0.001 in Kruskal-Wallis with Dunn’s post-hoc test. Sample sizes for experimental groups are provided in Supplementary materials and methods (Additional file 1)
Fig. 3
Fig. 3
GCLC inhibitor L-BSO blocks aberrant growth, induces stress response and inhibits mTORC1 in TSC2 depleted neurons. a Representative images and neuron soma area of TSC2-depleted and control neurons treated with 10 μM L-BSO. Scale bar: 50 μm. Plot represents mean +/−SEM. ns- not significant, **p < 0.01, ***p < 0.001 in Kruskal-Wallis with Dunn’s post-hoc test. Sample sizes for experimental groups are provided in Supplementary materials and methods (Additional file 1). b Western blot analysis of HO-1, Hsp70, GCLC and mTORC1 activity marker, P-S6, levels in TSC2-depleted and control neurons after L-BSO treatment. α-tubulin is shown as a loading control
Fig. 4
Fig. 4
Patients’ brain lesions show markers of oxidative stress and GCLC expression. Representative images of immunohistochemical staining of Heme oxygenase 1 (HO-1), Heat shock protein 70 (Hsp70), glutamate-cysteine ligase catalytic subunit (GCLC) in control brain sections (gray and white matter) and TSC patients’ brain sections (cortical tubers and SEGAs). Arrows point to dysmorphic neurons, giant cells, and enlarged SEGA cells. Cell nuclei are stained with hematoxylin. Insets show higher magnification. Scale bar: 80 μm. For additional controls, see Additional file 3: Figure S2
Fig. 5
Fig. 5
GCLC inhibition blocks growth of SEGA-derived cells and causes cellular stress, and mTORC1 inhibition. a Representative images (left) and results of cell surface area analysis (right) of SEGA-derived cells imaged 3 times during a 5 day-treatment. SEGA#1 and SEGA#2-derived cells were treated with 20 nM rapamycin, 20 nM rapamycin with 20 μM U0126 or 20 μM L-BSO, and 20 or 100 μM L-BSO. Scale bar: 100 μm. The plots represent mean +/− SEM from two independent experiments. ***p < 0.001 in two-way ANOVA compared to control treated with DMSO. Sample sizes for experimental groups are provided in Supplementary materials and methods (Additional file 1). b Western blot analysis of stress markers (Hsp70, HO-1), Nrf2, mTORC1 activity marker P-S6, genotoxic stress marker P-p53 and P-Raptor in SEGA-derived cells lysed after a 1-, 3- or 5-day treatment with 20 or 100 μM L-BSO. α-tubulin is shown as a loading control
Fig. 6
Fig. 6
GCLC inhibition causes death of SEGA-derived cells. a Schematic representation of SEGA-derived cell classes after an 8-day treatment. b Percentage of cells classified to class A, B, or C after treatment with 20 nM rapamycin, 20 nM rapamycin with 20 μM U0126 or 20 μM L-BSO, and 20 or 100 μM L-BSO. SEGA#1 and SEGA#2-derived cells were imaged 4 times during the treatment. Next, the fate of each cell was followed and classes were assigned. Sample sizes for experimental groups are provided in Supplementary materials and methods (Additional file 1). For additional information, see also Additional file 3: Figure S3. c Western blot analysis of PARP (full length and cleaved, upper and lower band, respectively) in SEGA-derived cells lysed after a 1-, 3- or 5-day treatment with 20 or 100 μM L-BSO. α-tubulin is shown as a loading control. d Proposed model of GCLC contribution to TSC-related tumors development

Similar articles

Cited by

References

    1. Bailey HH, Mulcahy RT, Tutsch KD, Arzoomanian RZ, Alberti D, Tombes MB, Wilding G, Pomplun M, Spriggs DR. Phase I clinical trial of intravenous L-buthionine sulfoximine and melphalan: an attempt at modulation of glutathione. J Clin Oncol. 1994;12:194–205. - PubMed
    1. Boutin C, Diestel S, Desoeuvre A, Tiveron M-C, Cremer H. Efficient in vivo electroporation of the postnatal rodent forebrain. PLoS One. 2008;3:e1883. doi: 10.1371/journal.pone.0001883. - DOI - PMC - PubMed
    1. Brummelkamp TR, Bernards R, Agami R. A system for stable expression of short interfering RNAs in mammalian cells. Science. 2002;296:550–553. doi: 10.1126/science.1068999. - DOI - PubMed
    1. Buccoliero AM, Franchi A, Castiglione F, Gheri CF, Mussa F, Giordano F, Genitori L, Taddei GL. Subependymal giant cell astrocytoma (SEGA): Is it an astrocytoma? Morphological, immunohistochemical and ultrastructural study. Neuropathology. 2009;29:25–30. doi: 10.1111/j.1440-1789.2008.00934.x. - DOI - PubMed
    1. Butcher RA, Bhullar BS, Perlstein EO, Marsischky G, LaBaer J, Schreiber SL. Microarray-based method for monitoring yeast overexpression strains reveals small-molecule targets in TOR pathway. Nat Chem Biol. 2006;2:103–109. doi: 10.1038/nchembio762. - DOI - PubMed

Publication types

MeSH terms