

Evaluation of variant detection software for pooled next-generation sequence data
- PMID: 26220471
- PMCID: PMC4518579
- DOI: 10.1186/s12859-015-0624-y
Evaluation of variant detection software for pooled next-generation sequence data
Abstract
Background: Despite the tremendous drop in the cost of nucleotide sequencing in recent years, many research projects still utilize sequencing of pools containing multiple samples for the detection of sequence variants as a cost saving measure. Various software tools exist to analyze these pooled sequence data, yet little has been reported on the relative accuracy and ease of use of these different programs.
Results: In this manuscript we evaluate five different variant detection programs-The Genome Analysis Toolkit (GATK), CRISP, LoFreq, VarScan, and SNVer-with regard to their ability to detect variants in synthetically pooled Illumina sequencing data, by creating simulated pooled binary alignment/map (BAM) files using single-sample sequencing data from varying numbers of previously characterized samples at varying depths of coverage per sample. We report the overall runtimes and memory usage of each program, as well as each program's sensitivity and specificity to detect known true variants.
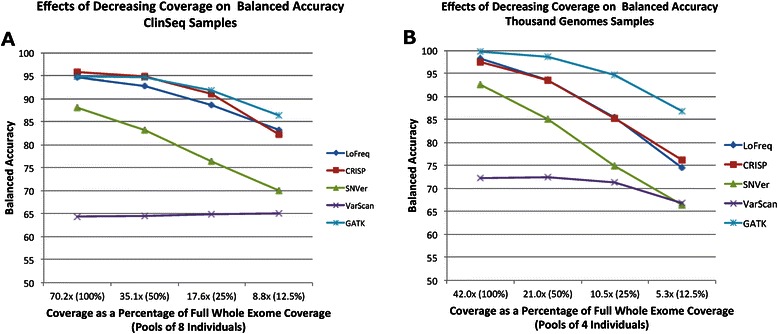
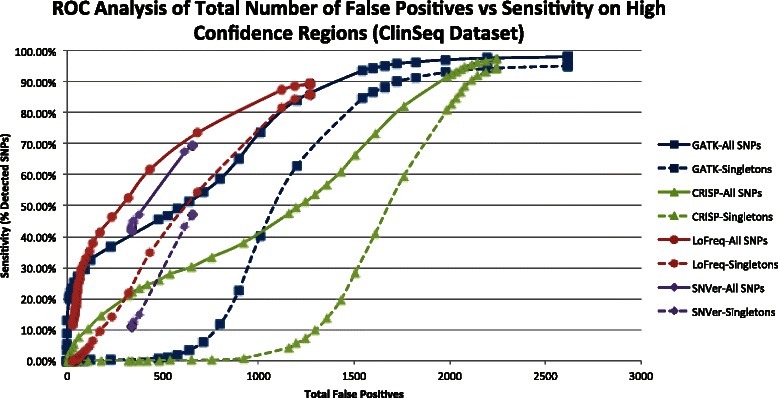
Conclusions: GATK, CRISP, and LoFreq all gave balanced accuracy of 80% or greater for datasets with varying per-sample depth of coverage and numbers of samples per pool. VarScan and SNVer generally had balanced accuracy lower than 80%. CRISP and LoFreq required up to four times less computational time and up to ten times less physical memory than GATK did, and without filtering, gave results with the highest sensitivity. VarScan and SNVer had generally lower false positive rates, but also significantly lower sensitivity than the other three programs.
Figures

References
-
- Wetterstrand KA: DNA sequencing costs: Data from the NHGRI genome sequencing program (GSP). 2014 [http://www.genome.gov/sequencingcosts]. Accessed October 10, 2014.
-
- Baltagi BH, Bresson G, Pirotte, A: To pool or not to pool? The econometrics of panel data (pp. 517–546) Springer Berlin Heidelberg 2008.
Publication types
MeSH terms
Substances
Grants and funding
LinkOut - more resources
Full Text Sources
Other Literature Sources
Miscellaneous
