. 2015 Jul 29:6:7677.
doi: 10.1038/ncomms8677.

Loss of ATM accelerates pancreatic cancer formation and epithelial-mesenchymal transition

Affiliations

Loss of ATM accelerates pancreatic cancer formation and epithelial-mesenchymal transition

Ronan Russell et al. Nat Commun. .

Abstract

Pancreatic ductal adenocarcinoma (PDAC) is associated with accumulation of particular oncogenic mutations and recent genetic sequencing studies have identified ataxia telangiectasia-mutated (ATM) mutations in PDAC cohorts. Here we report that conditional deletion of ATM in a mouse model of PDAC induces a greater number of proliferative precursor lesions coupled with a pronounced fibrotic reaction. ATM-targeted mice display altered TGFβ-superfamily signalling and enhanced epithelial-to-mesenchymal transition (EMT) coupled with shortened survival. Notably, our mouse model recapitulates many features of more aggressive human PDAC subtypes. Particularly, we report that low expression of ATM predicts EMT, a gene signature specific for Bmp4 signalling and poor prognosis in human PDAC. Our data suggest an intimate link between ATM expression and pancreatic cancer progression in mice and men.


Figures
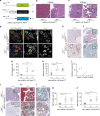
Figure 1
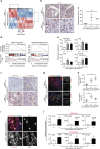
Figure 1. ATM loss of function promotes neoplastic changes in the pancreas in the context of oncogenic K-ras.
(a) Illustration of strategy to generate p48Cre;KrasG12D/+;Atm−/− mice (p48Cre/+=“C”; Kras G12D/+=“K”; Atm−/−=“A”). (b,c) Representative haematoxylin and eosin (H&E)-stained sections of pancreas at the indicated time points (b) scale bar, 200 μm, (c) scale bar, 500 μm. (d) Immunofluorescence staining of pancreas from the respective genotypes at 10 weeks old shows expression of CK19 (red), amylase (green) and nuclei (Dapi-blue). Scale bar, 20 μm. (e,f) Immunohistochemistry shows expression of (e) CK19 (scale bar, 200 μm) and (f) alcian blue (scale bar, 500 μm) in precursor lesions. Scale bar, 20 μm, (gi) Quantification of (g) CK19-positive cells, (h) ADM events per visual field, (i) PanIN grading and numbers are shown according to the genotype at 10 weeks. Colour code: Black=Atm+/+; Blue =Atm+/− and Red=Atm−/−. (jl) Immunohistochemical staining reveals (j) Ki67 (scale bar, 500 μm), (k) fibrosis (Masson–Goldner) (scale bar, 500 μm) and (l) α-SMA (scale bar, 20 μm) at sites of pre-malignant lesions in pancreata from the indicated genotypes and respective quantifications: (m,n). Representative images from at least three mice per genotype are shown. *P<0.05, **P<0.01, ***P<0.0001. One-way analysis of variance (ANOVA). Error bars are the means±s.e.m.
Figure 2
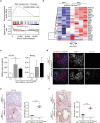
Figure 2. Epithelial-to-mesenchymal transition (EMT) is accelerated in ATM-targeted pancreata.
(a) Genome-wide transcriptional profiling identified 2,472 differentially regulated genes shown as a hierarchically clustered heat map of pancreata from 10 week aged p48Cre/+;KrasG12D/+;Atm−/−(AKC) - and p48Cre/+;KrasG12D/+;Atm+/+(KC)- mice. (b,c) Immunohistochemistry (left panel, scale bar, 20 μm, right panel, scale bar, 10 μm) and quantitative analysis (c) of Sox9 positivity in precursor lesions. Representative images of normal acini of the respective genotypes are also shown to illustrate ductal programming in AKC mice (B, right panel). (d) GSEA of differentially regulated genes from (a) shows enrichment of EMT-associated genes in p48Cre/+;KrasG12D/+;Atm−/− pancreata using two independent ‘GSE sets'. (e) RT-qPCR showing increased levels of Fibronectin, Twist1, Fsp1 and Vimentin in the pancreas of p48Cre/+;KrasG12D/+;Atm−/− and p48Cre/+;KrasG12D/+;Atm+/− versus controls (n=5 per group). Student's t-test *P<0.05. Error bars, s.e.m. (f) Immunohistochemistry staining shows expression of Vimentin and Fibronectin in precursor lesions. Scale bar, 20 μm. (g) Immunofluorescence stainings reveal more abundant expression of Zeb1-positive cells in CK19-positive precursor lesions of AKC-pancreata compared with controls. Scale bar, 20 μm. (h) Quantitative analysis of vimentin and Zeb1-positive cells in precursor lesions in the, respective, genotypes. (i) Immunofluorescence staining in p48Cre/+;KrasG12D/+;Atm−/−;Rosa_tdRFPfl/fl mice against RFP (red) and ZEB1 (green) and Dapi (blue). Scale bar, 10 μm. (j) RT-qPCR analysis showing expression levels of Sox9 (ADM: n=4 versus 6; PanIN: n=4 versus 5), Slug (ADM: n=4 versus 6; PanIN: n=4 versus 6) and N-cadherin (ADM: n=3 versus 6; PanIN: n=3 versus 6) in microdissected ADM or PanIN lesions from p48Cre/+;KrasG12D/+;Atm+/+ and p48Cre/+;KrasG12D/+;Atm−/− animals, respectively. Mann–Whitney test was used for statistical analysis. *P<0.05, **P<0.01. Error bars, s.e.m.
Figure 3
Figure 3. ATM depletion enriches for cancer stem cells and associated signalling pathways.
(a) Gene set enrichment analysis of differentially regulated genes from (Fig. 2a) identifies enrichment of a stem cell associated gene set in AKC pancreata at 10 weeks of age. (b) Hierarchically clustered heat map illustration shows differential expression of stemness-associated genes among AKC mice. (c) RT-qPCR showing increased levels of CD133 and Nanog in the pancreas of AKC mice versus controls. (d) Immunofluorescence staining of pancreata from the respective genotypes at 10 weeks old shows expression of CK19 (red), CD133 (green) and nuclei (Dapi-blue). Scale bar, 20 μm. (e,f) IHC staining and quantifications for CD133 (scale bar, 20 μm) (e) and Cxcr4 (scale bar, 10 μm) (f) in the respective genotypes.
Figure 4
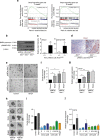
Figure 4. Loss of ATM activity compromises acinar cell integrity.
(a) GSEA of the differentially regulated genes from the respective genotypes identifies enrichment of the BMP4 signalling signature in p48Cre/+;KrasG12D/+;Atm−/− pancreata at 5 weeks and 10 weeks of age. (b) Immunoblot of BMP4, Phospho-Smad 1/5/8 and β-actin in the respective genotypes. (c) Quantification of several immunoblots as representative images in b for the following mouse numbers. Bmp4: 4 KC versus 6 AKC animals. SPmad 1/5/8: 4 KC versus 5 AKC animals. Mann–Whitney test was used for statistical analysis. *P<0.05, **P<0.01. Error bars, s.e.m. (d) Bmp4 staining of KC and AKC mice pancreata shows predominant Bmp4 staining in the acinar compartment of AKC mice. Staining is representative for at least three mice per group. Scale bar, 10 μm. (e) Bright-field images of acinar cell cultures from freshly isolated acini cultured for 2 days in growth factor reduced matrigel under indicated conditions. BMP4 was used at 25 ng ml−1; n=4. Scale bar, 50 μm. (f,g) Quantification of ductal structures at day 2 of culture and RT-qPCR showing levels of the ductal gene marker CK19 in the respective conditions. Fold changes were calculated by setting levels in control treated Atm+/+ acini to 1. Mann–Whitney test was used for statistical analysis. *P<0.05, **P<0.01. Error bars, s.e.m. (h) High-power bright-field images of acinar cell cultures under the indicated conditions at day 2 of culture. Scale bar, 10 μm. (i) Quantification of ductal structures at day 2 and (j) RT-qPCR analysis showing levels of the ductal marker gene CK19 in the respective conditions from Atm−/− acini (2 out of 3 experiments with similar results are shown). Error bars, s.e.m. All analyses were performed on 4- to 6-week-old animals.
Figure 5
Figure 5. ATM deficiency reduces PDAC survival in mice and men.
(a) Kaplan–Meier analysis of survival of p48Cre/+;KrasG12D/+;Atm−/− and p48Cre/+;KrasG12D/+;Atm+/- and p48Cre;KrasG12D/+;Atm+/+ mice. Ageing target mice were killed upon obvious signs of wasting. Log-rank (Mantel-Cox) test **P<0.01, ****P<0.0001. (b) Representative images of tumours arising in p48Cre/+;KrasG12D/+;Atm−/− mice (top panel: inlet: macroscopic tumour, left image: low-power (scale bar, 50 μm), right image: high-power (scale bar, 20 μm) (lower panel: Ck19 stained tumour, left image: low-power (scale bar, 200 μm), middle image: high power (scale bar, 20 μm) and right image: IHC for ki67 stained tumour (scale bar, 20 μm)). (c) An example of an associated liver metastasis stained for H&E and Ck8/18. Left panel, scale bar, 50 μm; right panel, scale bar, 20 μm. (d) Heat map depicting tumour characteristics from individual mice of the respective genotypes. Black=negative; Red=positive. (e) Hierarchical clustering using Euclidian distance shows that pancreata from p48Cre/+;KrasG12D/+;Atm−/− mice cluster more closely with human PDACs having a quasi-mesenchymal subtype. p48Cre/+;KrasG12D/+;Atm+/+ mice pancreata cluster as described previously more with the ‘classical' subtype PDAC. (f) GSEA plots show an abundance of tumour onset and poor survival gene sets in AKC pancreata.
Figure 6
Figure 6. ATM expression in human PDAC.
(a,b) Immunohistochemical staining (a) and quantification (b) of ATM protein expression in human pancreatic sections. Tumours were graded according to the WHO classification. Numbers analysed are given in the text. Left panel, scale bar, 100 μm; middle and right panel, scale bar, 50 μm. P values are determined by two-sided Fisher's exact test. *P=0.0472, ***P=0.0001. (c,d) The same TMA set from (a,b) was stained for pancytokeratin. (c) Representative images for ATM-low/EMT-high case and vice versa are shown. Scale bar, 50 μm. (d) Quantification of all samples for EMT according to ATM status. P values are determined by two-sided Fisher's exact test. ***P=0.0004. (e) Pancreatic cancer data from ICGC were retrieved from GSE36924. The samples were divided into two, ATM-high (>7.6) and ATM-low (=<7.6), groups on the basis of expression of ATM gene. Kaplan–Meier analysis of survival in patients with PDAC reveals that low levels of ATM mRNA correlate with shortened overall survival. Log-rank (Mantel-Cox) test *P<0.05 (f,g) Accordingly, GSEA was performed on the ATM high versus ATM low patient cohort to evaluate the significance of pre-defined gene sets, (f) a stem cell associated gene set and (g) a BMP4-signalling signature.
Figure 7
Figure 7. Schematic model depicting the role of ATM in PDAC progression.
ATM loss in the context of oncogenic K-ras enhances acinar to ductal reprogramming (ADR) via acinar to ductal metaplasia (ADM) accompanied by EMT and hyperactive BMP4 signalling. Cream colour=acinar structures, blue colour=ductal cells, green=desmoplasia, yellow=ductal cell undergoing EMT.

References

    1. Jemal A., Siegel R., Xu J. & Ward E. Cancer statistics, 2010. CA. Cancer J. Clin. 60, 277–300 (2010) . - PubMed
    1. Wellner U. et al.. The EMT-activator ZEB1 promotes tumorigenicity by repressing stemness-inhibiting microRNAs. Nat. Cell Biol. 11, 1487–1495 (2009) . - PubMed
    1. Waddell N. et al.. Whole genomes redefine the mutational landscape of pancreatic cancer. Nature 518, 495–501 (2015) . - PMC - PubMed
    1. Stathis A. & Moore M. J. Advanced pancreatic carcinoma: current treatment and future challenges. Nat. Rev. Clin.Oncol. 7, 163–172 (2010) . - PubMed
    1. Biankin A. V. et al.. Pancreatic cancer genomes reveal aberrations in axon guidance pathway genes. Nature 491, 399–405 (2012) . - PMC - PubMed

Publication types

MeSH terms

Associated data