. 2015 Oct;172(20):4905-18.
doi: 10.1111/bph.13259. Epub 2015 Oct 15.

Addition of a single methyl group to a small molecule sodium channel inhibitor introduces a new mode of gating modulation

Affiliations

Addition of a single methyl group to a small molecule sodium channel inhibitor introduces a new mode of gating modulation

Lingxin Wang et al. Br J Pharmacol. 2015 Oct.

Abstract

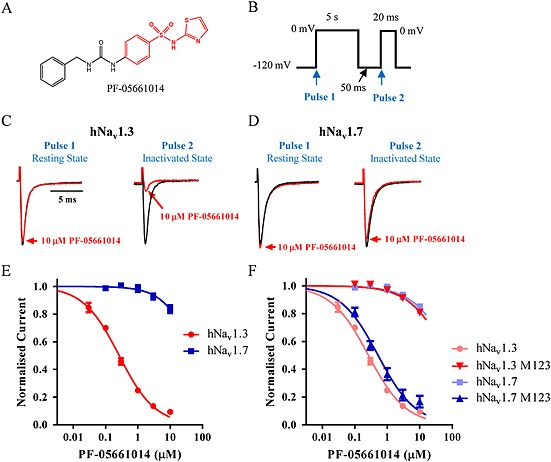
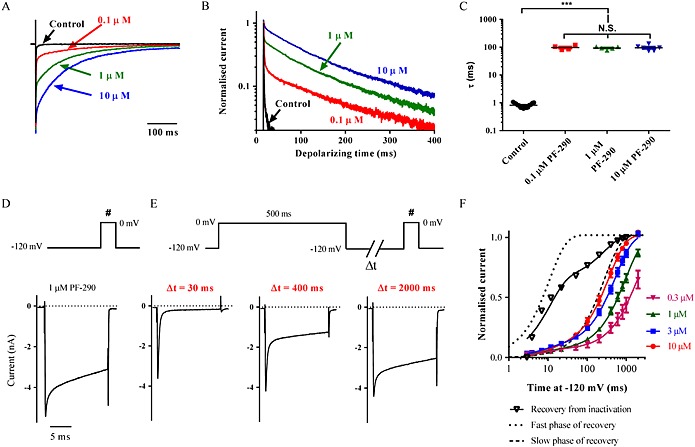
Background and purpose: Aryl sulfonamide Nav 1.3 or Nav 1.7 voltage-gated sodium (Nav ) channel inhibitors interact with the Domain 4 voltage sensor domain (D4 VSD). During studies to better understand the structure-activity relationship of this interaction, an additional mode of channel modulation, specifically slowing of inactivation, was revealed by addition of a single methyl moiety. The objective of the current study was to determine if these different modulatory effects are mediated by the same or distinct interactions with the channel.

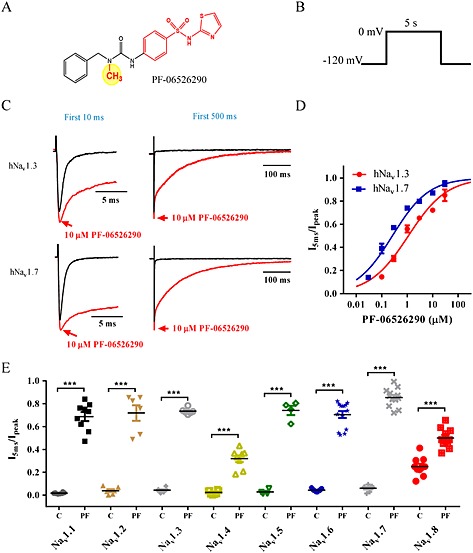
Experimental approach: Electrophysiology and site-directed mutation were used to compare the effects of PF-06526290 and its desmethyl analogue PF-05661014 on Nav channel function.

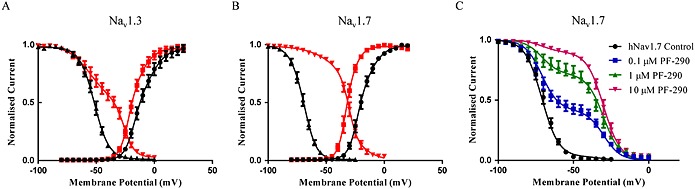
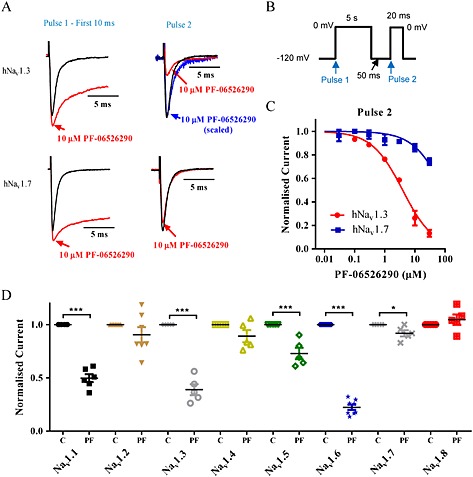
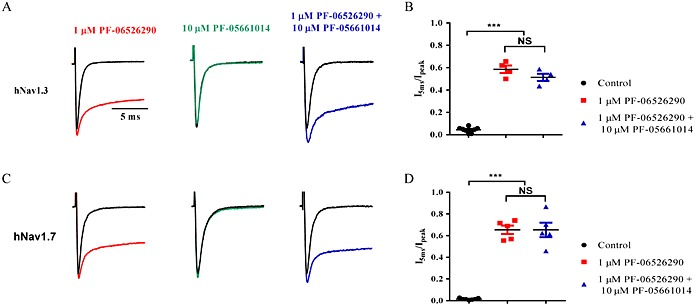
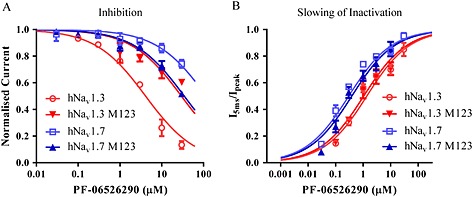
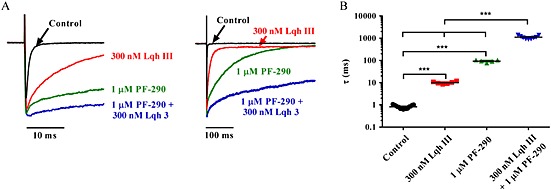
Key results: PF-05661014 selectively inhibits Nav 1.3 versus Nav 1.7 currents by stabilizing inactivated channels via interaction with D4 VSD. In contrast, PF-06526290, which differs from PF-05661014 by a single methyl group, exhibits a dual effect. It greatly slows inactivation of Nav channels in a subtype-independent manner. However, upon prolonged depolarization to induce inactivation, PF-06526290 becomes a Nav subtype selective inhibitor similar to PF-05661014. Mutation of the D4 VSD modulates inhibition of Nav 1.3 or Nav 1.7 by both PF-05661014 and PF-06526290, but has no effect on the inactivation slowing produced by PF-06526290. This finding, along with the absence of functional inhibition of PF-06526290-induced inactivation slowing by PF-05661014, suggests that distinct interactions underlie the two modes of Nav channel modulation.

Conclusions and implications: Addition of a methyl group to a Nav channel inhibitor introduces an additional mode of gating modulation, implying that a single compound can affect sodium channel function in multiple ways.


Figures

Figure 1
Figure 1
Selective inhibition of Nav channel subtypes by PF‐05661014. (A) Structure of PF‐05661014. (B) Voltage protocol employed to evaluate PF‐05661014 activity. Cells were depolarized to 0 mV for 5 s from a holding potential of −120 mV, then repolarized to −120 mV for 50 ms to allow recovery from inactivation of unmodified channels followed by a depolarizing step to 0 mV for 20 ms to test available sodium current. Measurement of current amplitude at ‘Pulse 1’ provides a measure of resting state inhibition, whereas ‘Pulse 2’ provides a measure of inactivated state inhibition. (C) and (D) Representative current traces showing the effect of PF‐05661014 on both resting state (Pulse 1) and inactivated states (Pulse 2) of human Nav1.3 and Nav1.7. Current traces have been normalized so that control traces have same relative amplitude. (E) Concentration‐dependence of human Nav1.3 and Nav1.7 inhibition by PF‐05661014 [IC50 0.26 ± 0.04 μM (n = 5) for Nav1.3 and >10 μM for Nav1.7 (n = 5)]. (F) Introduction of M123 (S1510Y/R1511W/E1559D) residues into Nav1.7 increases sensitivity to PF‐05661014 similar to that observed with Nav1.3 [IC50: 0.26 ± 0.04 μM (n = 5) for Nav1.3, 0.52 ± 0.17 μM (n = 6) for Nav1.7 M123]. Likewise, introduction of M123 (Y1537S/W1538R/D1586E) residues into Nav1.3 reduces its sensitivity to PF‐05661014 similar to that of Nav1.7 (IC50 > 10 μM).
Figure 2
Figure 2
PF‐06526290 slows Nav channel inactivation. (A) Structure of PF‐06526290 – differs from PF‐05661014 by a methyl group on the urea linker (yellow circle). (B) Protocol employed to test PF‐06526290 effect on sodium channel function. (C) Current traces for first 10 ms (left) or 500 ms (right) of the 5 s voltage step to 0 mV showing the effect of PF‐06526290 on human Nav1.3 and Nav1.7 channel activity. (D) Concentration‐dependence of human Nav1.3 and Nav1.7 slowed inactivation following PF‐06526290 treatment. Magnitude of PF‐06526290‐induced slowing of inactivation was calculated by normalizing sodium current amplitude 5 ms after peak‐to‐peak amplitude. [EC50 0.27 ± 0.08 μM (n = 5) for Nav1.7 and 1.1 ± 0.1 μM (n = 6) for Nav1.3]. (E) Effect of 10 μM PF‐06526290 on inactivation of different human sodium channel subtypes. For each sodium channel subtype, results before (C) and after application of 10 μM PF‐06526290 (PF) are shown. Effect of PF‐06526290 was calculated as described in (D) ***P < 0.001.
Figure 3
Figure 3
Effect of PF‐06526290 on voltage‐dependence of activation and inactivation of Nav1.3 and Nav1.7. (A) and (B) Voltage‐dependence of activation and inactivation of Nav1.3 and Nav1.7 in the absence (black) and presence (red) of 10 μM PF‐06526290. hNav1.3: activation V1/2: −12 ± 1, k: 7 ± 1.0 (n = 5); inactivation V1/2: −52 ± 1, k: 6 ± 1 (n = 5); with 10 μM PF‐06526290: activation V1/2: −19 ± 1, k: 6 ± 1 (n = 5); inactivation V1/2: −37 ± 2, k: 13 ± 2 (n = 5). hNav1.7: Activation V1/2: −20 ± 1, k: 6 ± 1 (n = 4); inactivation V1/2: −70 ± 0.6, k: 6 ± 0.5 (n = 5); with 10 μM PF‐06526290: activation V1/2: −32 ± 1, k: 6 ± 1 (n = 3); inactivation V1/2: −32 ± 1, k: 6 ± 1 (n = 6). (C) Voltage‐dependence of inactivation of Nav1.7 in the presence of 0.1, 1 and 10 μM PF‐06526290. Each data set was fitted to a double Boltzmann equation where each of the V1/2 and slope of inactivation parameters were fixed to either the control or 10 μM PF‐06526290 values shown in (B). However, the relative proportion of current with either the −70 or −32 mV V1/2 was adjusted to give best fit for each concentration of PF‐06526290 tested.
Figure 4
Figure 4
PF‐06526290 produces subtype selective inhibition of Nav channels following prolonged depolarization. (A) Comparison of PF‐06526290 effects on Nav1.3 and Nav1.7 current traces elicited by the protocol shown in (B). Whereas slowing of inactivation by 10 μM PF‐06526290 is observed for both channel subtypes with Pulse 1, only inhibition of Nav1.3 current was observed with Pulse 2. Furthermore, neither Nav1.7 nor Nav1.3 current traces elicited by Pulse 2 exhibited the slowing of inactivation observed with Pulse 1 (for Nav1.3, the blue trace reflects the uninhibited component scaled to control). (C) Concentration‐dependence of human Nav1.3 and Nav1.7 inhibition by PF‐06526290 [IC50 5 ± 2 μM (n = 6) for Nav1.3 and > 30 μM (n = 6) for Nav1.7]. (D) Inhibitory effect of PF‐06526290 on different Nav channel subtypes tested. For each sodium channel subtype, data before (C) and after application of 10 μM PF‐06526290 (PF) are shown *P < 0.05, ***P < 0.001.
Figure 5
Figure 5
Properties of PF‐06526290‐induced slowing of Nav channel inactivation. (A) Current traces of Nav1.7 in the absence and presence of 0.1, 1 and 10 μM PF‐06526290. Sodium currents were elicited by voltage steps to 0 mV for 500 ms from a holding potential of −120 mV (current amplitudes are normalized to peak for each trace). (B) Same sodium current traces from (A) normalized to peak and plotted on a log scale. (C) Time constant of inactivation (τ) in the absence and presence of 0.1, 1 and 10 μM PF‐06526290. Current decay was fit with a single exponential using Clampfit 10.3 software. There is no significant difference between the calculated time constants for slow phase of inactivation at different concentrations of PF‐06526290. ***P < 0.001 (D) Nav1.7 current trace evoked by a single pulse depolarization to 0 mV for 20 ms from a holding potential of −120 mV in presence of 1 μM PF‐06526290. (E) Current traces elicited by the voltage protocol shown in the presence of 1 μM PF‐06526290. A 500 ms depolarizing voltage step to 0 mV was applied to functionally displace PF‐06526290. A rest period at −120 mV of variable duration was applied before a 20 ms test pulse (indicated by #) to assess the fraction of the current exhibiting slowed inactivation. (F) Concentration‐dependence of time course for recovery of slowed inactivation after 500 ms voltage step to 0 mV in presence of PF‐06526290. The I 5 ms / I peak current amplitude ratios determined during the test pulse (#) are plotted versus time at −120 mV after 500 ms voltage step to 0 mV. τRecovery was determined from a least squares fit of a double exponential with the slow phase contributing 92–94% of the recovery for each concentration and τslow being 2311 ± 18, 994 ± 121, 540 ± 72 and 363 ± 63 ms for 0.3, 1, 3 and 10 μM PF‐06526290 respectively (n = 5–6). For comparison, the time course for recovery of Nav1.7 inactivation following a 500 ms voltage step to 0 mV in the absence of PF‐06526290 is also shown (Control). Data were fit with a double exponential with τfast = 11 ± 2, τslow = 270 ± 128 ms and fast/slow ratio of 0.74. The time course for fast and slow components of recovery from inactivation are illustrated by dotted and dashed curves respectively. Results shown in (D)–(F) were obtained using Molecular Devices PatchXpress automated patch clamp platform.
Figure 6
Figure 6
No functional interaction between PF‐05661014 and PF‐06526290 (A) Nav1.3 current traces in the presence and absence of 1 μM PF‐06526290, or 10 μM PF‐05661014, or a mixture of 1 μM PF‐06526290 and 10 μM PF‐05661014. (B) Comparison of magnitude of slowed inactivation (determined by I 5 ms / I peak ratio) with 1 μM PF‐06526290 alone and in combination with 10 μM PF‐05661014. Effects are not statistically different. (C) and (D) Same set of experiments performed on Nav1.7 as shown in (A) and (B). Again, no difference in magnitude of inactivation slowing with 1 μM PF‐06526290 alone or in combination with 10 μM PF‐05661014 was observed.
Figure 7
Figure 7
Mutation of Domain 4 VSD M123 motif modulates inhibition but not slowing of inactivation by PF‐06526290. (A) Introduction of M123 (S1510Y/R1511W/E1559D) residues into Nav1.7 increases sensitivity to inhibition by PF‐06526290, whereas introduction of M123 (Y1537S/W1538R/D1586E) residues into Nav1.3 reduces its sensitivity to inhibition by PF‐06526209 [IC50: 5 ± 2 μM (n = 6) for Nav1.3, 30 ± 5 μM (n = 3) for Nav1.3 M123, >100 uM (n = 6) for Nav1.7 and 35 ± 4 μM (n = 3) for Nav1.7 M123]. (B) Mutation of M123 residues have no effect on PF‐06526290 induced slowing of inactivation in either Nav1.3 or Nav1.7 [EC50: 1.1 ± 0.1 μM (n = 5) for Nav1.3, 1.1 ± 0.4 μM (n = 4) for Nav1.3 M123, 0.27 ± 0.08 μM (n = 6) for Nav1.7 and 0.39 ± 0.13 μM (n = 3) for Nav1.7 M123].
Figure 8
Figure 8
PF‐06526290‐mediated slowing of Nav1.7 inactivation is enhanced by site 3 targeting scorpion toxin, Lqh 3. (A) Nav1.7 current traces recorded in the presence of 300 nM Lqh 3, 1 μM PF‐06526290 (PF‐290), or a mixture of 300 nM Lqh 3 + 1 μM PF‐06526290. Currents were elicited by a 5 s voltage step from −120 to 0 mV (traces show first 20 and 500 ms). (B) Plot of inactivation time constants (τinact) in the absence and presence of 300 nM Lqh3, 1 μM PF‐06526290 (PF‐290), or a mixture of 300 nM Lqh 3 + 1 μM PF‐06526290. τinact was determined from a fit of a single exponential equation.
Figure 9
Figure 9
PF‐06526290 slows inactivation of endogenous Nav currents and increases neuronal excitability in mouse sensory neurons. (A) Sodium current traces showing the slowing of inactivation by 10 μM PF‐06526290 in the absence or presence of 200 nM TTX to isolate the TTX‐resistant component. Sodium currents were elicited by a single pulse test to 0 mV for 20 ms from a holding potential of −120 mV. (B) Plot of the I 5 ms / I peak current amplitude ratio in the presence of 10 μM PF‐06526290. (C) Effect of 0.3 μM PF‐06526290 on stimulus intensity (current injection in pA) required to initiate action potential. (D) Plot of current injection threshold for initiation of action potential in presence and absence of 0.3 μM PF‐06526290. (E) Time‐dependent change in action potential firing elicited by a 500 ms 150 pA supramaximal stimulus at 0.1 Hz in absence or following administration of 0.3 μM PF‐06526290. Plot time course of action potential frequency (F) or duration at 50% repolarization (G), in absence or following administration 0.3 μM PF‐06526290 using the same stimulus protocol as in (E).

Similar articles

Cited by

References

    1. Abbas N, Gaudioso‐Tyzra C, Bonnet C, Gabriac M, Amsalem M, Lonigro A et al. (2013). The scorpion toxin Amm VIII induces pain hypersensitivity through gain‐of‐function of TTX‐sensitive Na(+) channels. Pain 154 (8): 1204–1215. - PubMed
    1. Alexander SP, Benson HE, Faccenda E, Pawson AJ, Sharman JL, Catterall WA et al. (2013). The concise guide to PHARMACOLOGY 2013/14: ion channels. Br J Pharmacol 170: 1607–1651. - PMC - PubMed
    1. Bagal SK, Chapman ML, Marron BE, Prime R, Storer RI, Swain NA (2014). Recent progress in sodium channel modulators for pain. Bioorg Med Chem Lett 24 (16): 3690–3699. - PubMed
    1. Banzawa N, Saito S, Imagawa T, Kashio M, Takahashi K, Tominaga M et al. (2014). Molecular basis determining inhibition/activation of nociceptive receptor TRPA1 protein: a single amino acid dictates species‐specific actions of the most potent mammalian TRPA1 antagonist. J Biol Chem 289 (46): 31927–31939. - PMC - PubMed
    1. Bennett DL, Woods CG (2014). Painful and painless channelopathies. Lancet Neurol 13 (6): 587–599. - PubMed

Publication types

MeSH terms