. 2015 Sep;138(Pt 9):2659-71.
doi: 10.1093/brain/awv202. Epub 2015 Jul 28.

Association between α-synuclein blood transcripts and early, neuroimaging-supported Parkinson's disease

Affiliations

Association between α-synuclein blood transcripts and early, neuroimaging-supported Parkinson's disease

Joseph J Locascio et al. Brain. 2015 Sep.

Abstract

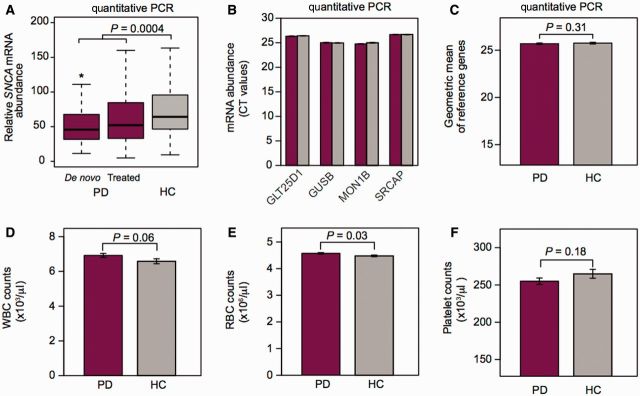
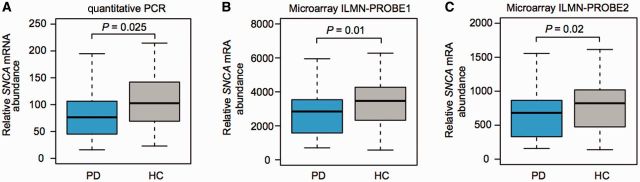
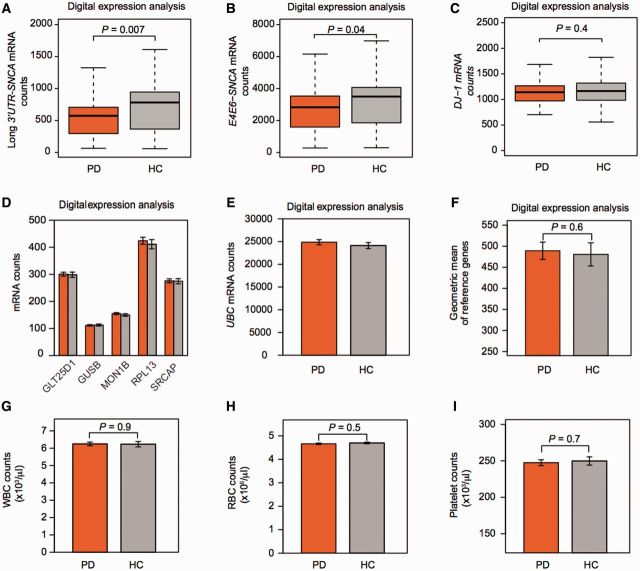
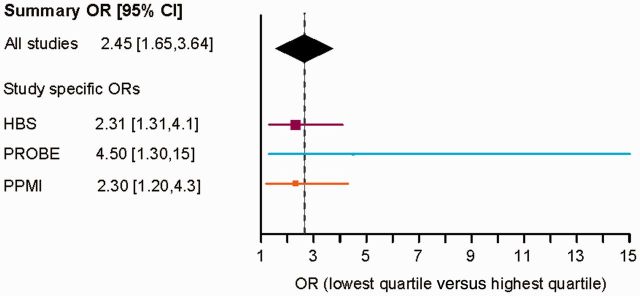
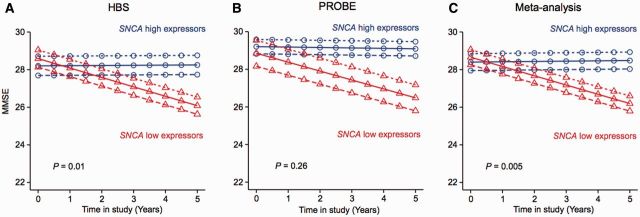
There are no cures for neurodegenerative diseases and this is partially due to the difficulty of monitoring pathogenic molecules in patients during life. The Parkinson's disease gene α-synuclein (SNCA) is selectively expressed in blood cells and neurons. Here we show that SNCA transcripts in circulating blood cells are paradoxically reduced in early stage, untreated and dopamine transporter neuroimaging-supported Parkinson's disease in three independent regional, national, and international populations representing 500 cases and 363 controls and on three analogue and digital platforms with P < 0.0001 in meta-analysis. Individuals with SNCA transcripts in the lowest quartile of counts had an odds ratio for Parkinson's disease of 2.45 compared to individuals in the highest quartile. Disease-relevant transcript isoforms were low even near disease onset. Importantly, low SNCA transcript abundance predicted cognitive decline in patients with Parkinson's disease during up to 5 years of longitudinal follow-up. This study reveals a consistent association of reduced SNCA transcripts in accessible peripheral blood and early-stage Parkinson's disease in 863 participants and suggests a clinical role as potential predictor of cognitive decline. Moreover, the three independent biobank cohorts provide a generally useful platform for rapidly validating any biological marker of this common disease.

Keywords: biobank; biomarker; cognitive decline; gene expression; mitochondria; α-synuclein.


Figures

None
The α-synuclein gene, SNCA, is selectively expressed in blood cells and neurons. Locascio et al. reveal a paradoxical reduction in SNCA transcript counts in the blood of individuals with early-stage, neuroimaging-supported Parkinson’s disease in three regional, national, and international populations. Low SCNA transcript abundance predicted subsequent cognitive decline.
Figure 1
Figure 1
HBS: reduced SNCA mRNA abundance in early-stage Parkinson’s disease. (A) Mean SNCA expression was significantly lower in 222 patients with early-stage clinical Parkinson’s disease (PD) compared to 183 controls (HC) without neurologic disease enrolled in the HBS using precise, quantitative PCR (unadjusted difference of 20%; P-value of 0.0004). *P-value = 0.01 for untreated, de novo cases versus controls. Box plots visualize first, third quartiles and means; the ends of the whiskers represent the lowest (or highest) value still within 1.5-times the interquartile range. (B) Expression values of the four endogenous reference genes used in the HBS were virtually identical in cases and controls. Cycle threshold (CT) values (standard error) are shown for cases (crimson bars) and controls (grey bars). (C) The geometric mean of these four endogenous reference genes was used to normalize for input RNA. (D–F) Importantly, complete blood counts in cases and controls could not account for the reduction in relative SNCA mRNA abundance in patients. Specifically, white blood cell counts (D, WBC) and platelet counts (F) did not significantly differ between cases and controls, while red blood cell counts (RBC) were marginally higher in cases than in controls (E; mean red blood cell, 4.6 versus 4.5, P = 0.03). Bar graphs show means and standard errors.
Figure 2
Figure 2
USA-wide, multicentre PROBE study: replication of low SNCA mRNA abundance in DAT imaging-confirmed Parkinson’s disease. (A) We further evaluated this association in 76 cases with DAT imaging-confirmed Parkinson’s disease and 42 controls enrolled in the PROBE study. A 22% reduction in levels of blood-SNCA expression was seen in cases compared to controls on the quantitative PCR platform (P = 0.025). (B and C) These results were technically replicated on a second, independent microarray expression platform that includes two distinct probes for SNCA. Results for each of the two probes confirmed that relative blood-SNCA expression was lower in cases compared to controls. Box plots visualize first, third quartiles and means; the ends of the whiskers represent the lowest (or highest) value still within 1.5-times the interquartile range.
Figure 3
Figure 3
PPMI: disease-relevant SNCA isoforms are already reduced near disease onset. (A and B) SNCA isoforms were probed on a highly robust digital expression platform in 202 cases with de novo motor Parkinson’s disease (PD), with less than 2 years of disease and with confirmed loss of dopaminergic substantia nigra terminals by DAT imaging and 138 age- and sex-matched controls (HC) without neurological disease and normal DAT imaging participating in PPMI. Unadjusted counts of disease-relevant SNCA transcript isoforms with long 3' UTR (A) or skipping exon 5 (B), were reduced by 27% and 19%, respectively, in de novo cases compared to controls (P = 0.007 and 0.04, respectively). (C) By contrast mean counts for the gene PARK7 (DJ-1) mutated in rare autosomal recessive Parkinson’s disease were not significantly different in de novo cases with sporadic Parkinson’s disease compared to controls (difference of 1.5%). Box plots visualize first, third quartiles and means; the ends of the whiskers represent the lowest (or highest) value still within 1.5-times the interquartile range. (D–F) Reference genes were stably expressed in blood cells of cases compared to controls. Counts of the six endogenous reference genes used in PPMI (D and E) were virtually identical in the 202 cases and 138 controls. Mean counts (standard error) are shown for cases (orange bars) and controls (grey bars). (F) The geometric mean of these six endogenous reference genes was used to normalize for input RNA. It was nearly identical in cases and controls. (G–I) White (WBC) and red (RBC) blood cell, and platelet counts did not differ significantly between cases and controls. Bar graphs show means and standard errors.
Figure 4
Figure 4
Risk of Parkinson’s is associated with relative SNCA transcript abundance. Individuals with SNCA transcript levels in the lowest quartile of values had a summary odds ratio for Parkinson’s disease of 2.45 (1.65, 3.64) compared to individuals with levels in the highest quartile in a meta-analysis across the three studies. In the Forrest plot squares represent the estimate of effect, i.e. the OR for each individual study, the size of the square corresponds to the size of the study, and bars around the square represent the 95% CI of the odds ratio. The diamond indicates the summary estimate; the width (the horizontal tips) of the diamond represents the 95% CI of the summary OR.
Figure 5
Figure 5
SNCA transcript abundance predicts cognitive decline in patients with Parkinson’s disease during longitudinal follow-up. (A) The 25% patients with Parkinson’s disease with the highest SNCA transcript levels at enrolment into HBS (n = 55; ‘SNCA high expressors’) and the 25% of patients with the lowest SNCA transcript levels at enrolment in HBS (n = 55; ‘low SNCA expressors’) were compared. Illustrative mean scores on the MMSE across time predicted from the estimated fixed effect parameters in the mixed random and fixed effects model analysis (Locascio and Atri, 2011) are shown for SNCA high expressors and SNCA low expressors. Low SNCA expressors showed accelerated longitudinal cognitive decline compared to high expressors with P = 0.01 adjusting for age, gender, disease duration upon enrolment, and years of education. (B) Mixed effects model analysis for the 25% SNCA high expressors (n = 16) versus the 25% low expressors in PROBE (n = 16) adjusting for covariates indicated a similar, but non-significant trend. (C) In the combined analysis, SNCA expression status was robustly confirmed as a predictor of longitudinal cognitive decline in Parkinson’s disease with P = 0.005 after adjusting for pertinent covariates and study. Illustrative mean scores on the MMSE across time predicted by the fitted model in the longitudinal analysis for Parkinson’s disease patients in the lowest quartile of SNCA expression levels are shown as red triangles; values for Parkinson’s disease patients in the highest quartile of SNCA expression levels are represented as blue circles (solid lines indicate predicted values for subjects with a mean value of disease duration at enrolment; large-dashed lines indicate those for individuals with 1 SD longer disease duration at enrolment; and short-dashed lines indicate those for subjects with 1 SD shorter disease duration at enrolment).

Comment in

References

    1. Andreassi C, Riccio A. To localize or not to localize: mRNA fate is in 3'UTR ends. Trends Cell Biol 2009; 19: 465–74. - PubMed
    1. Auer H, Lyianarachchi S, Newsom D, Klisovic MI, Marcucci G, Kornacker K. Chipping away at the chip bias: RNA degradation in microarray analysis. Nat Genet 2003; 35: 292–3. - PubMed
    1. Braak H, Del Tredici K, Bratzke H, Hamm-Clement J, Sandmann-Keil D, Rub U. Staging of the intracerebral inclusion body pathology associated with idiopathic Parkinson's disease (preclinical and clinical stages). J Neurol 2002; 249 (Suppl 3): III/1–5. - PubMed
    1. Chahine LM, Stern MB, Chen-Plotkin A. Blood-based biomarkers for Parkinson's disease. Parkinsonism Relat Disord 2014; 20 (Suppl 1): S99–103. - PMC - PubMed
    1. Chen-Plotkin AS. Unbiased approaches to biomarker discovery in neurodegenerative diseases. Neuron 2014; 84: 594–607. - PMC - PubMed

Publication types

MeSH terms

Substances