. 2015 Jul 15;11(9):1056-72.
doi: 10.7150/ijbs.12408. eCollection 2015.

Knockout of SRC-1 and SRC-3 in Mice Decreases Cardiomyocyte Proliferation and Causes a Noncompaction Cardiomyopathy Phenotype

Affiliations

Knockout of SRC-1 and SRC-3 in Mice Decreases Cardiomyocyte Proliferation and Causes a Noncompaction Cardiomyopathy Phenotype

Xian Chen et al. Int J Biol Sci. .

Abstract

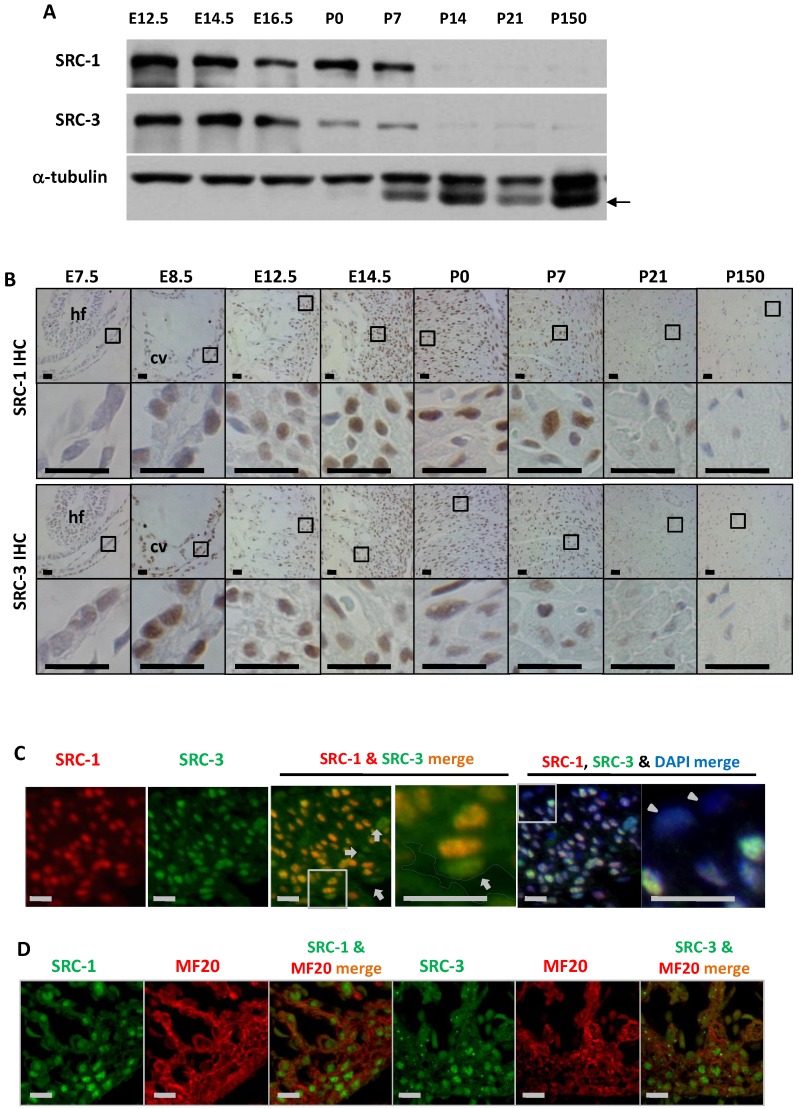
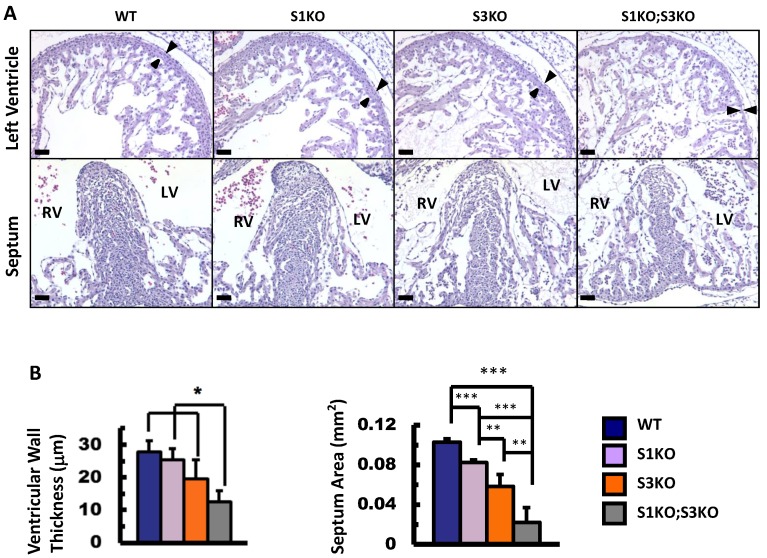
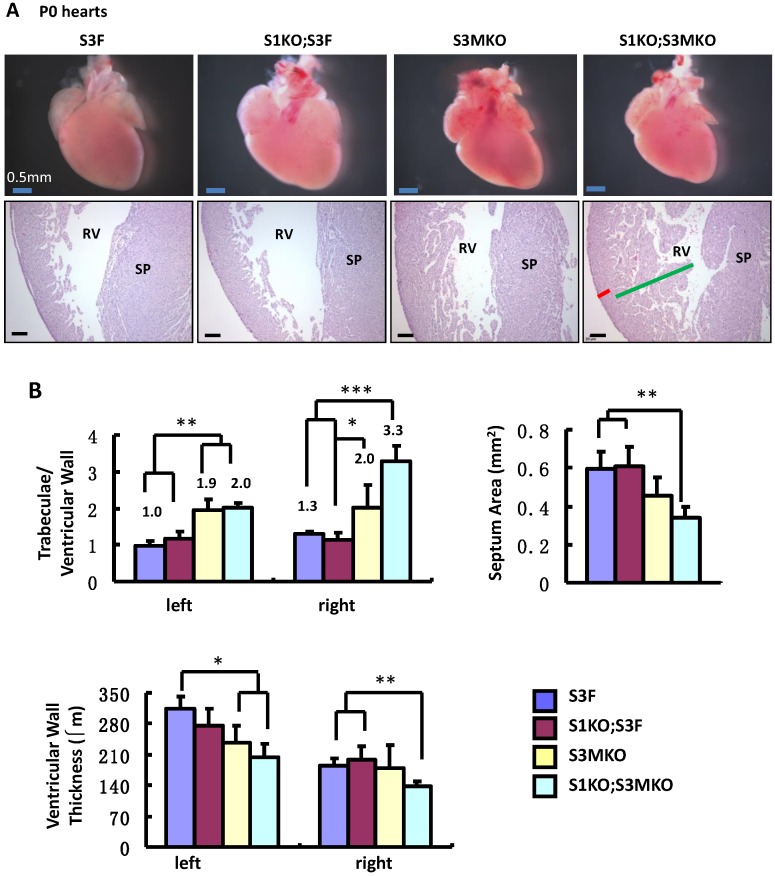
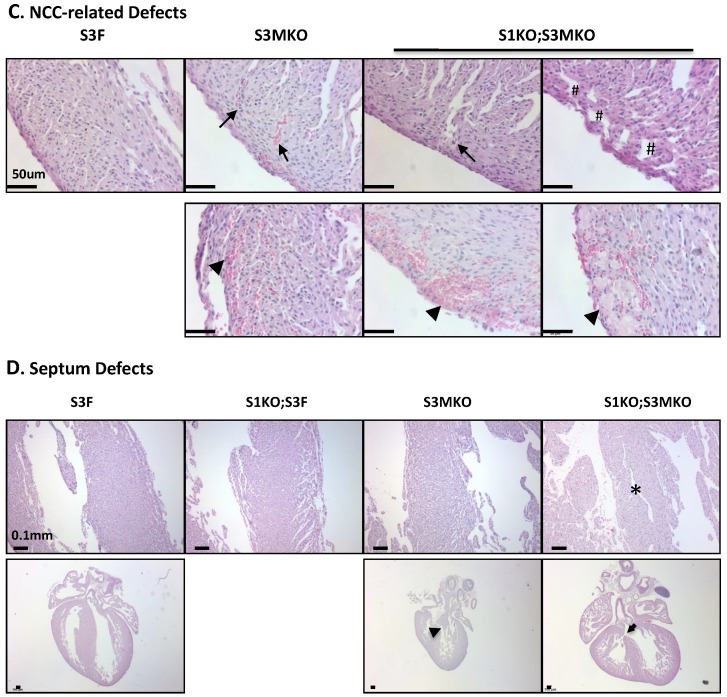
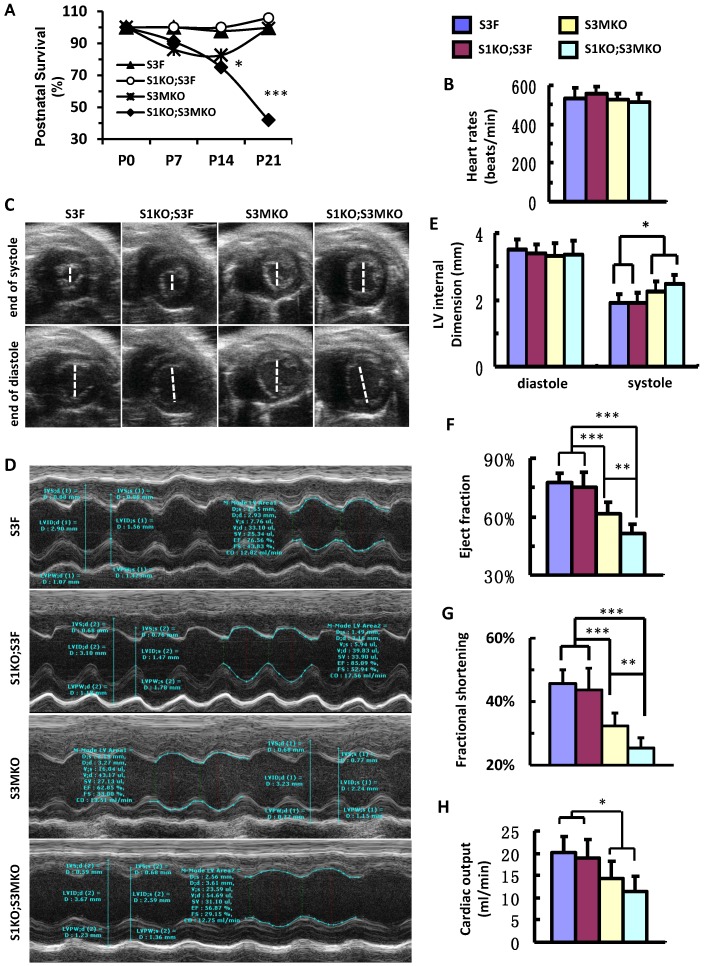
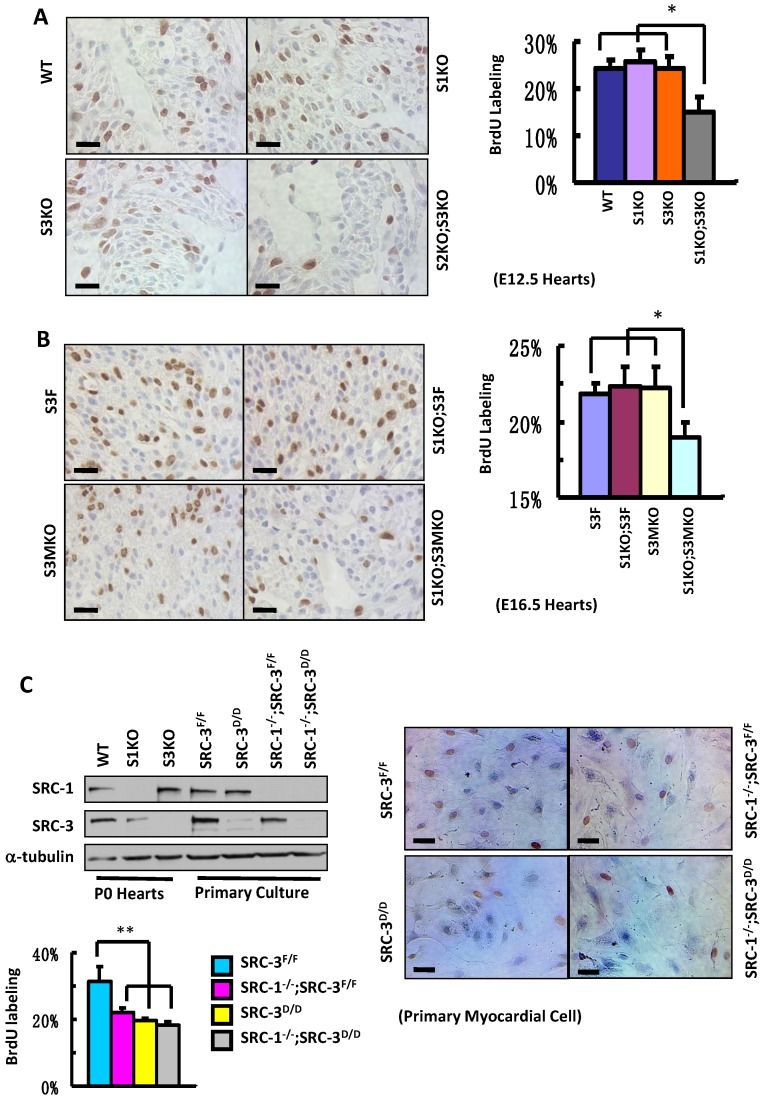
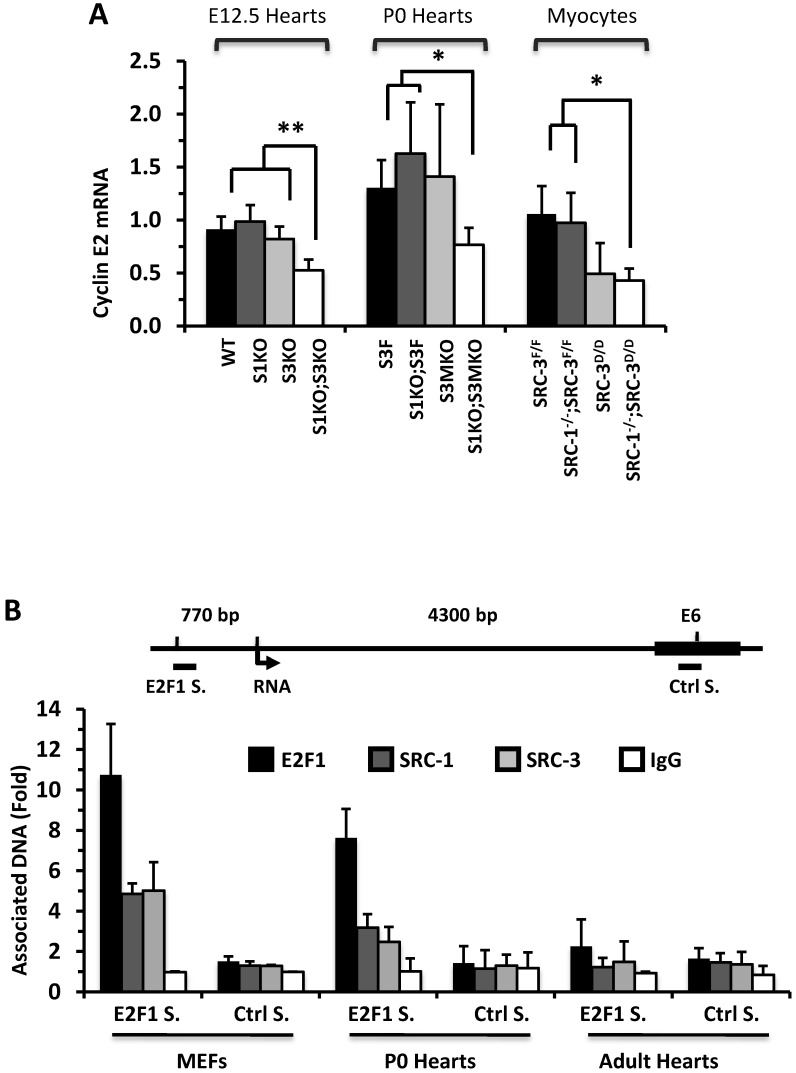
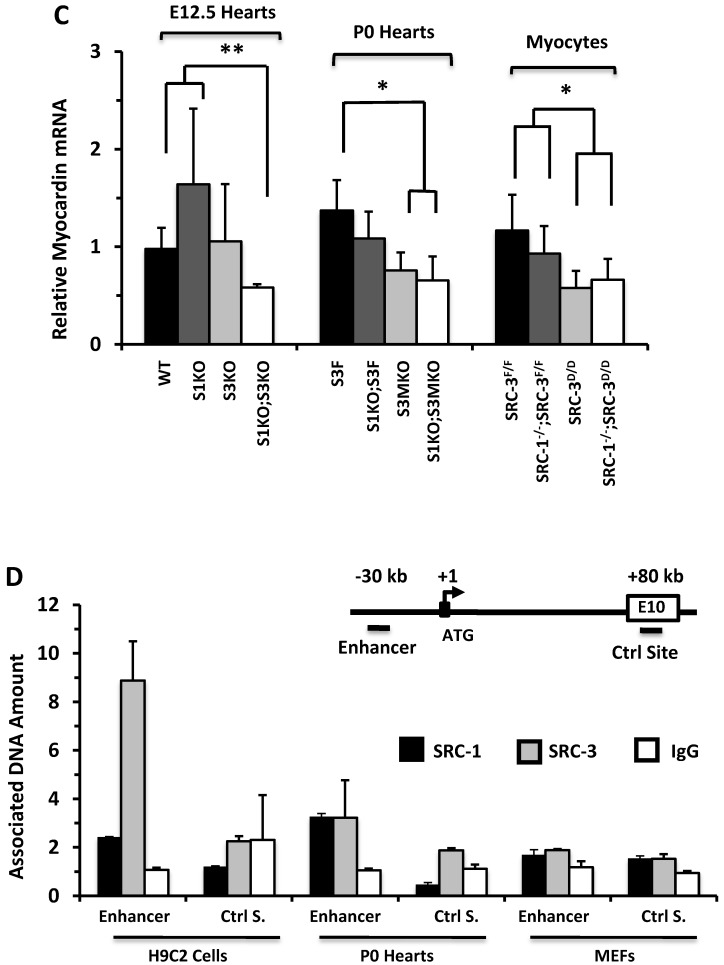
Noncompaction cardiomyopathy (NCC) is a congenital heart disease that causes ventricular dysfunction and high mortality rate in children. The mechanisms responsible for NCC are still unknown. The steroid receptor coactivator-1 (SRC-1) and SRC-3 are transcriptional coactivators for nuclear hormone receptors and certain other transcription factors that regulate many genes in development and organ function. However, the roles of SRC-1/3 in heart morphogenesis, function and NCC occurrence are unknown. This study aims to examine the spatial and temporal expression patterns of SRC-1/3 in the heart and investigate the specific roles of SRC-1/3 in heart development, function and NCC occurrence. Immunochemical analysis detected SRC-1/3 expressions in the proliferating cardiomyocytes of mouse heart at prenatal and neonatal stages, while these expressions disappeared within two weeks after birth. Through generating and characterizing mouse lines with global or cardiomyocyte-specific knockouts of SRC-1/3, we found ablation of SRC-1/3 in the myocardial lineage resulted in prominent trabeculae, deep intertrabecular recesses and thin ventricular wall and septum. These developmental defects caused a failure of trabecular compaction, decreased internal ventricular dimension, reduced cardiac ejection fraction and output and led to a high rate of postnatal mortality. Collectively, these structural and functional abnormalities closely simulate the phenotype of NCC patients. Further molecular analysis of cardiomyocytes in vivo and in vitro revealed that SRC-1/3 directly up-regulate cyclin E2, cyclin B1 and myocardin to promote cardiomyocyte proliferation and differentiation. In conclusion, SRC-1/3 are required for cardiomyocyte proliferation and differentiation at earlier developmental stages, and their dysfunction causes NCC-like abnormalities in the hearts of newborn and adult mice.

Keywords: cardiac output; heart diseases; knockout mice; myocyte proliferation; nuclear receptor coactivator.


Conflict of interest statement

Competing Interests: The authors have declared that no competing interest exists.

Figures

Figure 1
Figure 1
The spatiotemporal expression patterns of SRC-1 and SRC-3 proteins during heart development. A. Western blot analysis of SRC-1 and SRC-3 in the hearts of E12.5, E14.5, E16.5, P0, P7, P14, P21 and P150 normal mice. Each tissue lysate was prepared from at least 3 mouse hearts. The α-tubulin served as a loading control. The arrow indicates a mouse IgG band detected by the secondary antibody. B. Detection of SRC-1 and SRC-3 positive cells by IHC in the E7.5, E8.5, E12.5, E14.5, P0, P7, P21 and P150 mouse hearts. The boxed areas in the first and third row panels are magnified in the second and fourth row panels, respectively. At least three mouse hearts at each stage were examined, and representative images were shown. hf, head fold; cv, common ventricular chamber of the primitive heart. C. Double immunofluorescent staining for SRC-1 and SRC-3 in the left ventricular wall of the E12.5 normal mouse heart. The nuclei were stained by DAPI. The boxed areas in the third and fifth panels are magnified in the fourth and sixth panels, respectively. The outlined area in the fourth panel indicates the heart chamber. The arrows indicate endothelial cells. The arrowheads indicate the epicardium. D. Double immunofluorescent staining for SRC-1 and MF20 and for SRC-3 and MF20 in the ventricular wall of the E12.5 normal mouse heart. Scale bars in panels B, C and D, 20 μm.
Figure 2
Figure 2
Knockout of SRC-1 and SRC-3 reduced ventricular wall and septum morphogenesis in the E12.5 mouse hearts. A. H&E-stained coronal sections of the E12.5 hearts from embryos with the indicated genotypes. The arrowheads indicate the thickness of the compact ventricular wall. RV, right ventricle; LV, left ventricle. Scale bars, 20 μm. B. The average ventricular wall thicknesses and septum areas measured from the mouse hearts with indicated genotypes. Each group had at least 4 independent samples. *, ** and ***, p<0.05, p<0.01 and p<0.001 by Student's t test.
Figure 3
Figure 3
Morphological defects observed in the hearts of S3MKO and S1KO;S3MKO mice. A. Photographs of the P0 mouse hearts with the indicated genotypes (upper panels) and H&E-stained coronal sections showing the right ventricle and the septum areas (lower panels). The red and green lines indicate the thicknesses of the compact ventricular wall and the noncompacted trabecular layer of S1KO;S3MKO heart, respectively. RV, right ventricle; SP, septum; Scale bars, 0.5 mm (upper panels) and 0.1 mm (lower panels). B. Quantitative analysis of the ratios of trabecular to ventricular wall thicknesses, septum areas and ventricular wall thicknesses of the P0 mouse hearts with the indicated genotypes. Each group has at least 4 independent samples. *, ** and ***, p<0.05, p<0.01 and p<0.001 by Student's t test. C. Other NCC-relevant phenotypes observed in S3MKO and S1KO;S3MKO P0 hearts. Arrows indicate blood clots among the trabeculae; the “#” signs indicate spongy-like areas of the ventricular wall tissue; arrowheads indicate myocardial infarction. Scale bar, 50 μm. D. Some histological defects observed in the septums of S1KO;S3MKO and S3MKO hearts at P0. The septum of S3F and S1KO;S3F hearts is normal. Some S1KO;S3MKO septums contain spongy-like tissue (*) and unsealed holes between the right and left ventricles (arrow). An unsealed hole between the right atrial and left ventricle (arrowhead) was observed in one of the S3MKO hearts. Scale bars, 0.1 mm.
Figure 3
Figure 3
Morphological defects observed in the hearts of S3MKO and S1KO;S3MKO mice. A. Photographs of the P0 mouse hearts with the indicated genotypes (upper panels) and H&E-stained coronal sections showing the right ventricle and the septum areas (lower panels). The red and green lines indicate the thicknesses of the compact ventricular wall and the noncompacted trabecular layer of S1KO;S3MKO heart, respectively. RV, right ventricle; SP, septum; Scale bars, 0.5 mm (upper panels) and 0.1 mm (lower panels). B. Quantitative analysis of the ratios of trabecular to ventricular wall thicknesses, septum areas and ventricular wall thicknesses of the P0 mouse hearts with the indicated genotypes. Each group has at least 4 independent samples. *, ** and ***, p<0.05, p<0.01 and p<0.001 by Student's t test. C. Other NCC-relevant phenotypes observed in S3MKO and S1KO;S3MKO P0 hearts. Arrows indicate blood clots among the trabeculae; the “#” signs indicate spongy-like areas of the ventricular wall tissue; arrowheads indicate myocardial infarction. Scale bar, 50 μm. D. Some histological defects observed in the septums of S1KO;S3MKO and S3MKO hearts at P0. The septum of S3F and S1KO;S3F hearts is normal. Some S1KO;S3MKO septums contain spongy-like tissue (*) and unsealed holes between the right and left ventricles (arrow). An unsealed hole between the right atrial and left ventricle (arrowhead) was observed in one of the S3MKO hearts. Scale bars, 0.1 mm.
Figure 4
Figure 4
Postnatal survival and left ventricular dysfunction of SRC-1 and SRC-3 conditional knockout mice. A. The survival rates of the indicated genotypes after birth. The calculation was based on the observed numbers of S3F, S1KO;S3F, S3MKO and S1KO;S3MKO mice at P0 (n = 45, 47, 26 and 33), P7 (n = 36, 25, 18 and 16), P14 (n = 33, 19, 14 and 10) and P21 (n = 46, 72, 23 and 20) versus their predicted numbers at P0 (n = 40, 47, 46 and 47), P7 (n = 32, 25, 37 and 25), P14 (n = 30, 19, 30 and 19) and P21 (n = 41, 68, 41 and 68). Then, the survival rates for each genotype group were normalized to the survival rate at P0. * and ***, p < 0.05 and p < 0.001 by Chi-Square test. B. Heart rates measured by Doppler echocardiography (M-mode) from 5 to 7-month-old mice (n = 7-12 for each group) with the indicated genotypes. These mice were also used for collecting the data shown in panels C-G. C. Live heart images caught from Doppler echocardiograph videos (B-mode) at the ends of systole and diastole. The white lines indicate the internal dimension of ventricular chambers. D. M-mode echocardiographs of the left ventricles in mice with the indicated genotypes. E. The average internal dimensions of the left ventricular chambers of mice with the indicated genotypes. The data were calculated according to the Doppler echocardiographs (M-mode) recorded from 7-12 mice in each group. F. The average cardiac ejection fractions calculated from the Doppler echocardiographs (M-mode) of 7-12 mice in each group. G. The average cardiac fractional shortening calculated from the Doppler echocardiographs (M-mode) of 7-12 mice in each genotype group. H. The average cardiac outputs calculated from Doppler echocardiographs (M-mode) from 7-12 mice in each genotype group. *, ** and *** in panels E-H, p < 0.05, p < 0.01 and p < 0.001 by Student's t test, respectively.
Figure 5
Figure 5
Knockout of SRC-1 and SRC-3 compromises cardiomyocyte proliferation. A. IHC for detecting BrdU-labeled proliferating cells (brown) and the average percentages of BrdU-labeled cardiomyocytes in the hearts of WT, S1KO, S3KO and S1KO;S3KO mouse embryos at E12.5 (n = 3). B. IHC for detecting BrdU-labeled cells (brown) and the average percentages of proliferating cells in the hearts of S3F, S1KO;S3F, S3MKO and S1KO;S3MKO mouse embryos at E16.5 (n = 3). C. Knockout of SRC-1 and SRC-3 in primary myocardial cells in culture decreases their proliferation. In Western blot analysis, samples prepared from WT, S1KO and S3KO hearts at P0 were used as positive, SRC-1 knockout and SRC-3 knockout controls, respectively. Samples prepared from SRC-3f/f, SRC-3d/d, S1KO;SRC-3f/f and S1KO;SRC-3d/d primary cardiomyocytes were used to assay SRC-1 and SRC-3 protein levels. Each pool of the primary cardiomyocytes was prepared from multiple hearts with the same genotype. α-tubulin served as a loading control. The lower band detected by SRC-3 antibody is a SRC-3 splicing isoform. The proliferating cardiomyocytes were labeled by BrdU incorporation and detected by immunocytochemistry (brown). The BrdU-labeled cells were counted versus the total cell numbers for each genotype group. Scale bars in all images, 20 μm. Each group in all panels contained at least three independent samples and at least three randomly selected regions of each independent sample were examined for quantitative data analysis. * and **, p<0.05 and p<0.01 by Student's t test.
Figure 6
Figure 6
SRC-1 and SRC-3 regulate cyclin E2 and myocardin expression. A. Relative expression levels of cyclin E2 mRNA in the hearts (n = 4-6 for each group) of mice with the indicated genotypes at E12.5 and P0 and in the cultured primary cardiomyocytes (n = 3-4 for each group) with the indicated genotypes. B. E2F1, SRC-1 and SRC-3 are associated with the E2F1-binding site proximate to the promoter of the cyclin E2 gene. The E2F1-binding site (E2F1 S.), the RNA transcriptional initiation site and the distant negative control site (Ctrl S.) in extron 6 (E6) of the mouse cyclin E2 gene are sketched. ChIP assays were performed with MEFs, P0 heart tissues and adult heart tissues using antibodies against E2F1, SRC-1 and SRC-3, and non-immune IgG as a negative control. Relative amounts of DNA associated with E2F1, SRC-1 and SRC-3 were quantitatively assayed by real time PCR. The experiments were repeated three times. C. Relative mRNA levels of myocardin in E12.5 (n = 4-6 for each group), P0 hearts (n = 4-6 for each group) and the primary myocardial cells in culture with the indicated genotypes. * and ** in panels A and C, p < 0.05 and p < 0.01 by Student's t test. D. SRC-1 and SRC-3 are associated with the enhancer site of the mouse myocardin gene. The known functional enhancer region and the distant negative control site in E10 of the mouse myocardin gene are sketched. ChIP assays were carried out with H9C2 cells, P0 hearts and MEFs using SRC-1 and SRC-3 antibodies, and the non-immune IgG as a negative control. The relative amounts of precipitated DNA were quantitatively measured by real time PCR. The experiments were repeated three times.
Figure 6
Figure 6
SRC-1 and SRC-3 regulate cyclin E2 and myocardin expression. A. Relative expression levels of cyclin E2 mRNA in the hearts (n = 4-6 for each group) of mice with the indicated genotypes at E12.5 and P0 and in the cultured primary cardiomyocytes (n = 3-4 for each group) with the indicated genotypes. B. E2F1, SRC-1 and SRC-3 are associated with the E2F1-binding site proximate to the promoter of the cyclin E2 gene. The E2F1-binding site (E2F1 S.), the RNA transcriptional initiation site and the distant negative control site (Ctrl S.) in extron 6 (E6) of the mouse cyclin E2 gene are sketched. ChIP assays were performed with MEFs, P0 heart tissues and adult heart tissues using antibodies against E2F1, SRC-1 and SRC-3, and non-immune IgG as a negative control. Relative amounts of DNA associated with E2F1, SRC-1 and SRC-3 were quantitatively assayed by real time PCR. The experiments were repeated three times. C. Relative mRNA levels of myocardin in E12.5 (n = 4-6 for each group), P0 hearts (n = 4-6 for each group) and the primary myocardial cells in culture with the indicated genotypes. * and ** in panels A and C, p < 0.05 and p < 0.01 by Student's t test. D. SRC-1 and SRC-3 are associated with the enhancer site of the mouse myocardin gene. The known functional enhancer region and the distant negative control site in E10 of the mouse myocardin gene are sketched. ChIP assays were carried out with H9C2 cells, P0 hearts and MEFs using SRC-1 and SRC-3 antibodies, and the non-immune IgG as a negative control. The relative amounts of precipitated DNA were quantitatively measured by real time PCR. The experiments were repeated three times.

References

    1. Hoffman JI, Kaplan S. The incidence of congenital heart disease. J Am Coll Cardiol. 2002;39:1890–900. - PubMed
    1. Marelli AJ, Mackie AS, Ionescu-Ittu R. et al. Congenital heart disease in the general population: changing prevalence and age distribution. Circulation. 2007;115:163–72. - PubMed
    1. Bruneau BG. The developmental genetics of congenital heart disease. nature. 2008;451:943–8. - PubMed
    1. Jenni R, Oechslin E, Schneider J. et al. Echocardiographic and pathoanatomical characteristics of isolated left ventricular non-compaction: a step towards classification as a distinct cardiomyopathy. Heart. 2001;86:666–71. - PMC - PubMed
    1. Weiford BC, Subbarao VD, Mulhern KM. Noncompaction of the ventricular myocardium. Circulation. 2004;109:2965–71. - PubMed

Publication types

Substances