. 2015 Jul 29;10(7):e0134235.
doi: 10.1371/journal.pone.0134235. eCollection 2015.

NRF2 Signaling Negatively Regulates Phorbol-12-Myristate-13-Acetate (PMA)-Induced Differentiation of Human Monocytic U937 Cells into Pro-Inflammatory Macrophages

Affiliations

NRF2 Signaling Negatively Regulates Phorbol-12-Myristate-13-Acetate (PMA)-Induced Differentiation of Human Monocytic U937 Cells into Pro-Inflammatory Macrophages

Min-Gu Song et al. PLoS One. .

Abstract

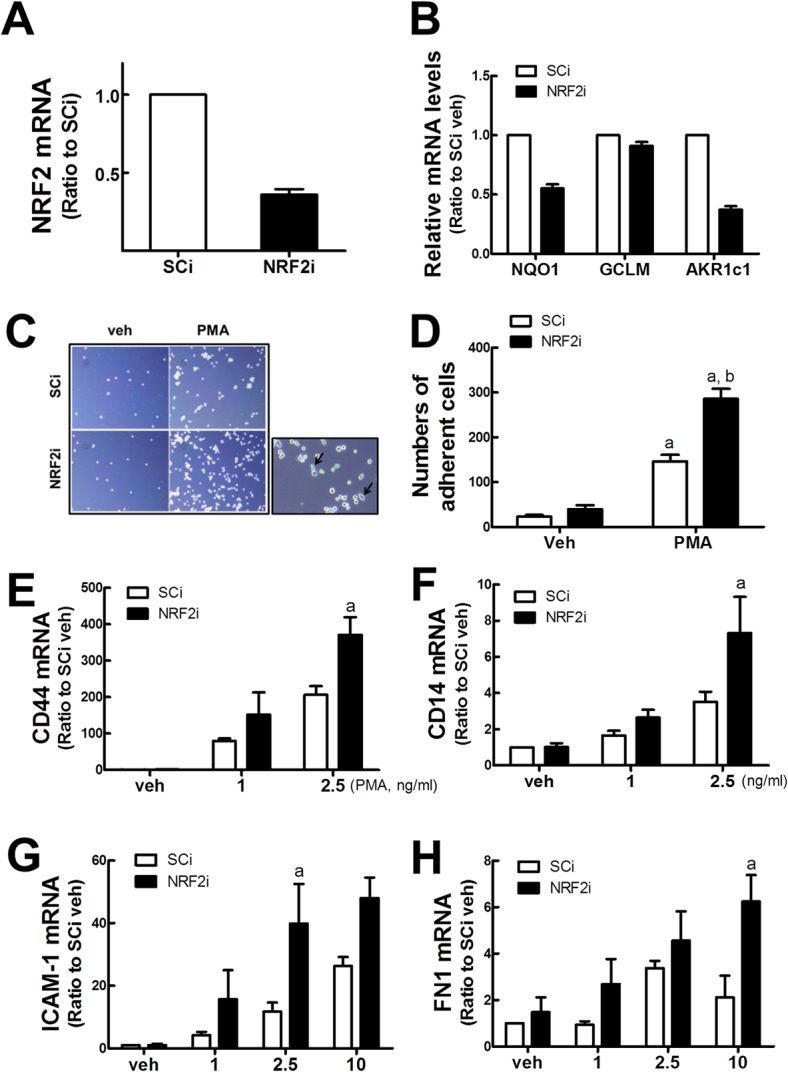
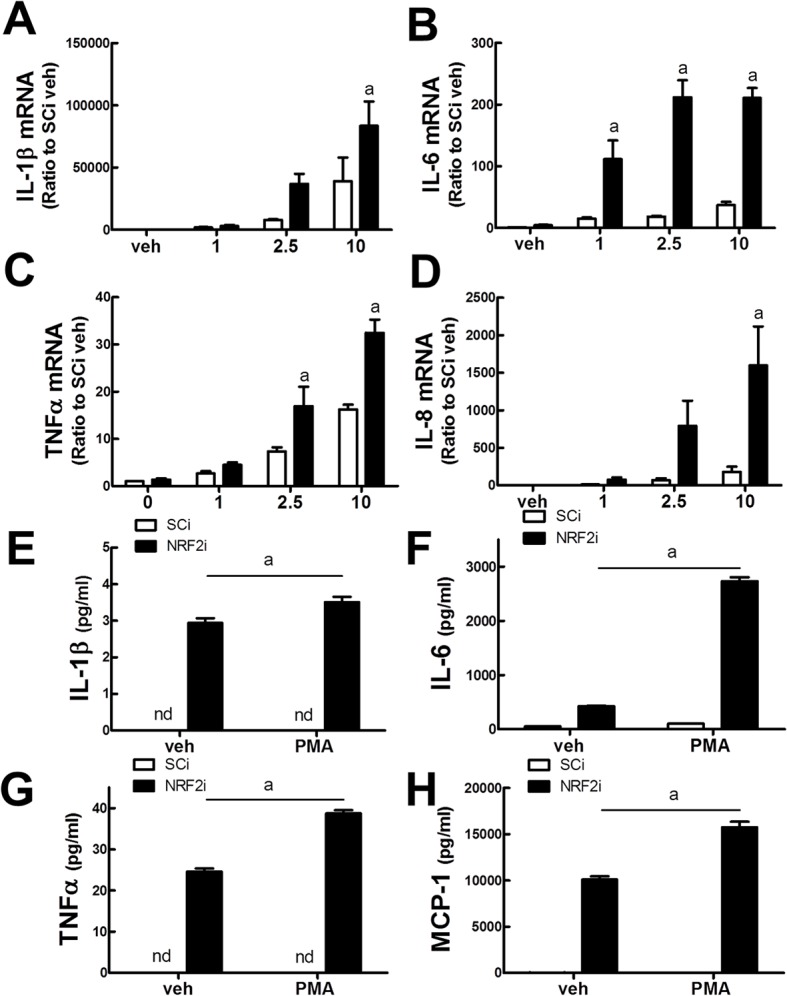
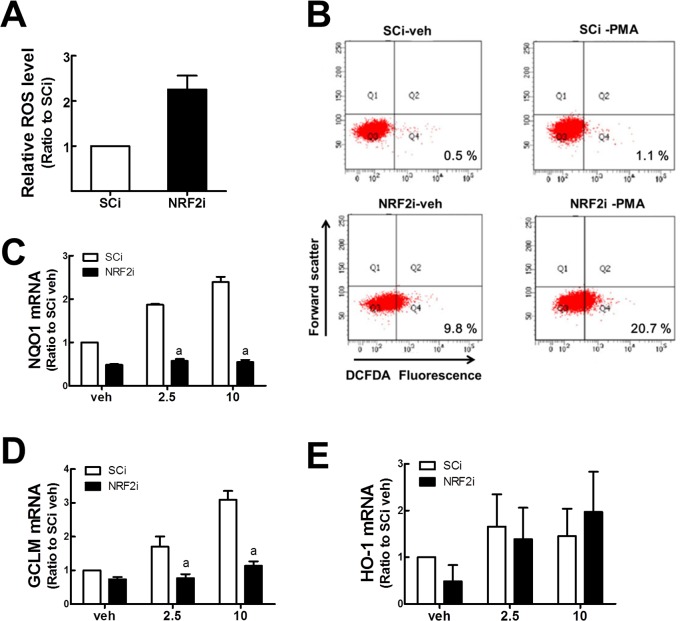
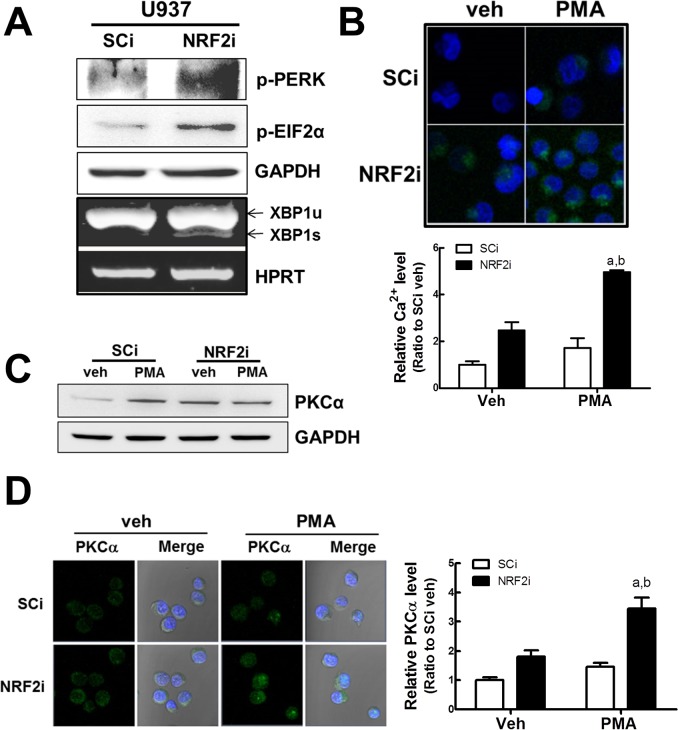
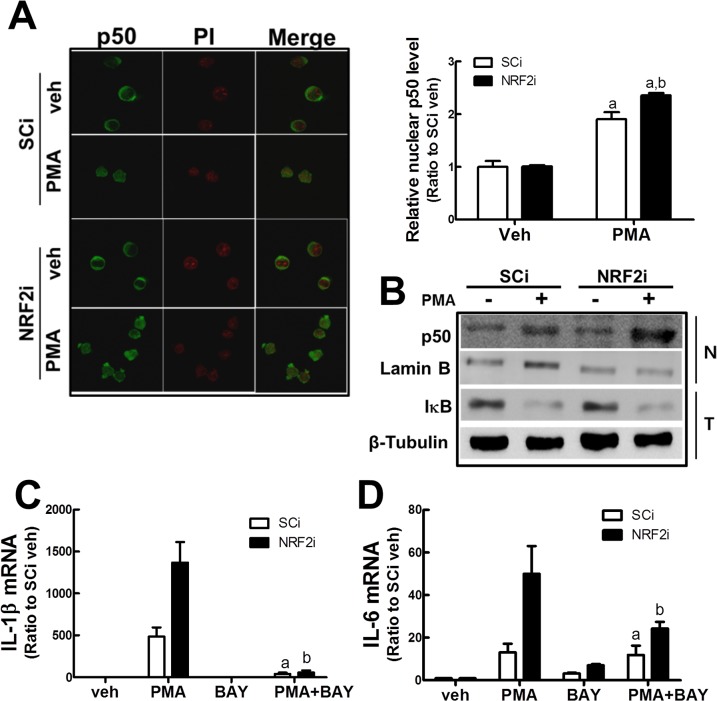
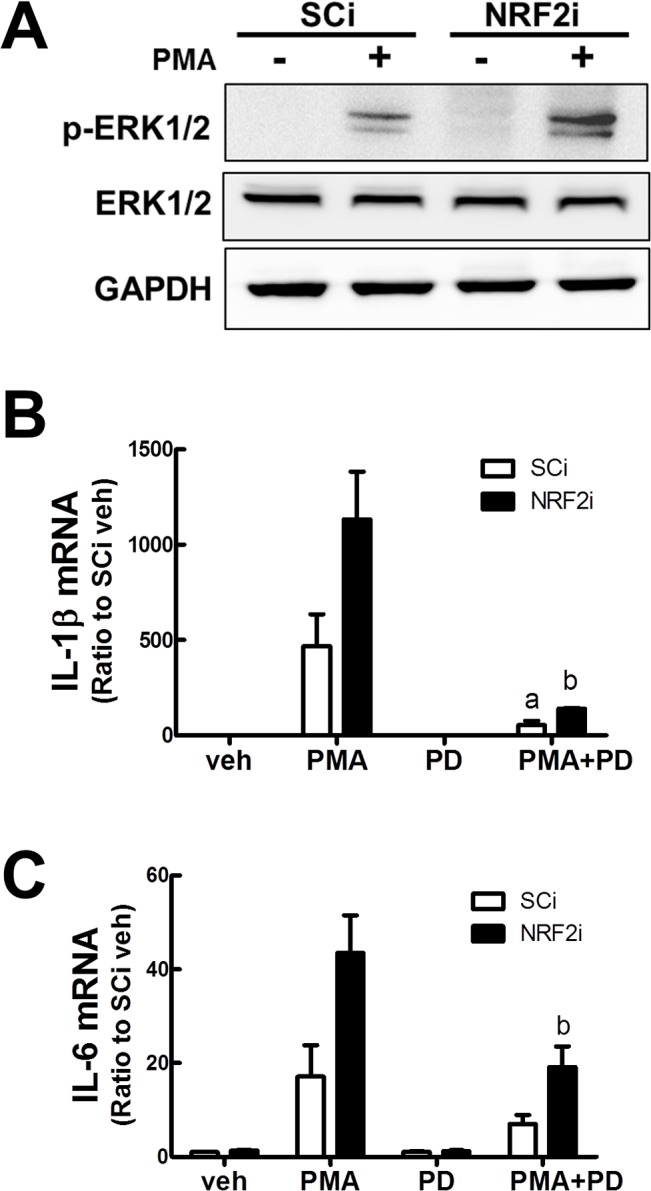
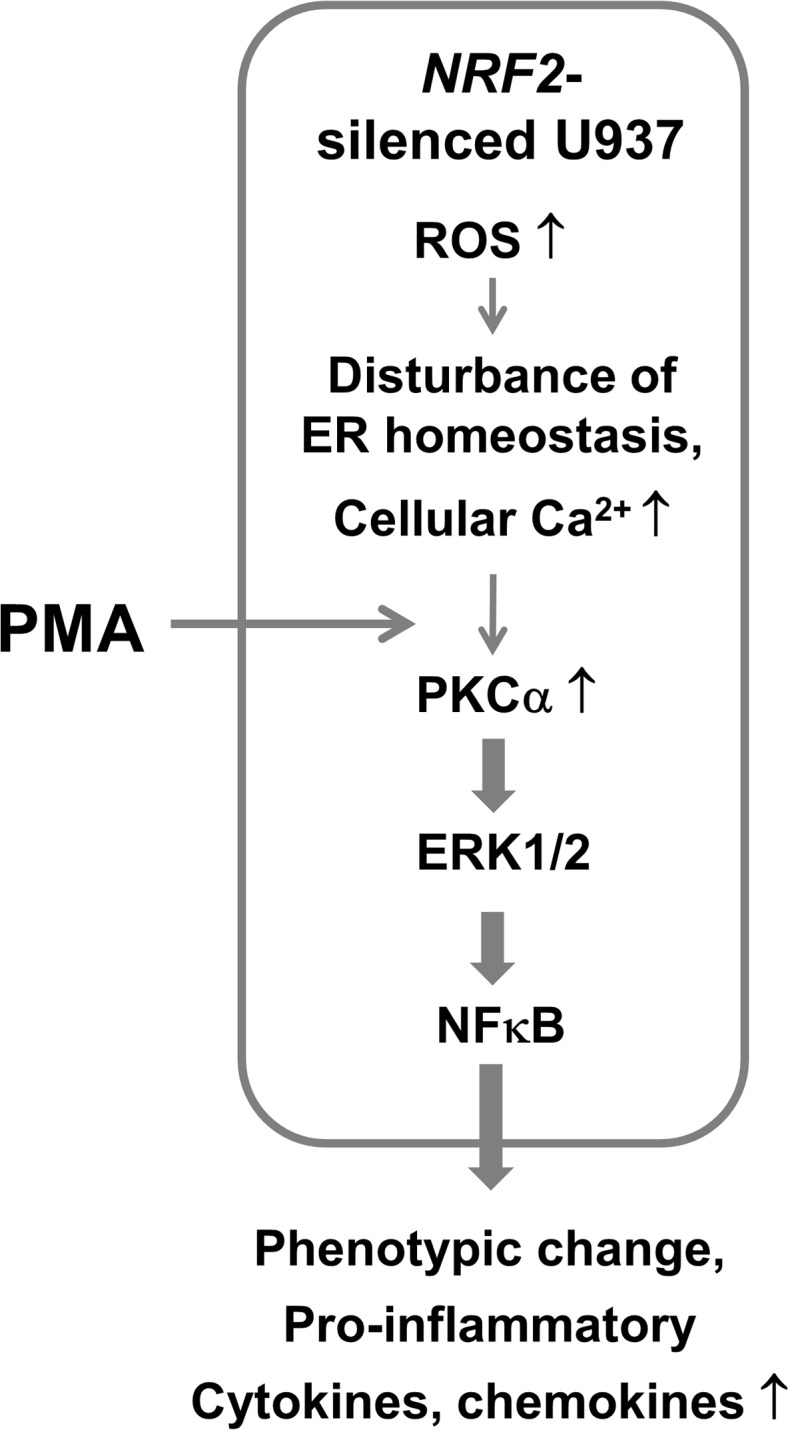
Blood monocytes are recruited to injured tissue sites and differentiate into macrophages, which protect against pathogens and repair damaged tissues. Reactive oxygen species (ROS) are known to be an important contributor to monocytes' differentiation and macrophages' function. NF-E2-related factor 2 (NRF2), a transcription factor regulating cellular redox homeostasis, is known to be a critical modulator of inflammatory responses. We herein investigated the role of NRF2 in macrophage differentiation using the human monocytic U937 cell line and phorbol-12-myristate-13-acetate (PMA). In U937 cells with NRF2 silencing, PMA-stimulated cell adherence was significantly facilitated when compared to control U937 cells. Both transcript and protein levels for pro-inflammatory cytokines, including interleukine-1β (IL-1β), IL-6, and tumor necrosis factor-α (TNFα) were highly elevated in PMA-stimulated NRF2-silenced U937 compared to the control. In addition, PMA-inducible secretion of monocyte chemotactic protein 1 (MCP-1) was significantly high in NRF2-silenced U937. As an underlying mechanism, we showed that NRF2-knockdown U937 retained high levels of cellular ROS and endoplasmic reticulum (ER) stress markers expression; and subsequently, PMA-stimulated levels of Ca2+ and PKCα were greater in NRF2-knockdown U937 cells, which caused enhanced nuclear accumulation of nuclear factor-ҡB (NFҡB) p50 and extracellular signal-regulated kinase (ERK)-1/2 phosphorylation. Whereas the treatment of NRF2-silenced U937 cells with pharmacological inhibitors of NFҡB or ERK1/2 largely blocked PMA-induced IL-1β and IL-6 expression, indicating that these pathways are associated with cell differentiation. Taken together, our results suggest that the NRF2 system functions to suppress PMA-stimulated U937 cell differentiation into pro-inflammatory macrophages and provide evidence that the ROS-PKCα-ERK-NFҡB axis is involved in PMA-facilitated differentiation of NRF2-silenced U937 cells.


Conflict of interest statement

Competing Interests: The authors have declared that no competing interests exist.

Figures

Fig 1
Fig 1. PMA-stimulated adherence of NRF2i U937 cells.
(A) Transcript levels of NRF2 in SCi and NRF2i U937 cells were measured by semi-quantitative real-time RT-PCR. (B) Transcript levels for NRF2-target genes, NQO1, GCLM, and AKR1c1, were determined by semi-quantitative real-time RT-PCR analysis. The expression levels of each gene were normalized with respect to the housekeeping gene HPRT. Data represent the means ± SD of 3–4 experiments. (C-D) SCi and NRF2i cells were incubated with vehicle (veh, ethanol) or PMA (10 ng/mL) for 24 h, and adherent cells were photographed following PBS washing (C). Arrows indicate cells with a macrophage-like morphology. Numbers of adherent cells were counted in microscopic images (D). Data represent the means ± SD of 3 microscopic areas. aP < 0.05 compared with vehicle control. bP < 0.05 compared with PMA-treated SCi cells. (E-H) Transcript levels of adhesion molecules in PMA-treated NRF2i U937 cells. SCi and NRF2i U937 cells were incubated with vehicle (ethanol) or PMA (1, 2.5, and 10 ng/mL) for 24 h, and transcript levels for adhesion molecules CD44 (E), CD14 (F), ICAM-1 (G), and extracellular matrix FN1 (H) were assessed by real-time RT-PCR analysis. Expression levels of each gene were normalized with respect to the housekeeping gene HPRT or GAPDH. Data represent the means ± SD of 3–4 experiments. aP < 0.05 compared with PMA-treated SCi cells.
Fig 2
Fig 2. Levels of pro-inflammatory cytokines and chemokine in PMA-treated NRF2i U937 cells.
(A-D) SCi and NRF2i U937 cells were incubated with vehicle (ethanol) or PMA (1, 2.5, and 10 ng/mL) for 24 h, and transcript levels of pro-inflammatory cytokines IL-1β (A), IL-6 (B), and TNFα (C), and chemokine IL-8 (D) were determined by real-time RT-PCR analysis. Expression levels of each gene were normalized with respect to the housekeeping gene HPRT or GAPDH. Data represent the means ± SD of 3–4 experiments. aP < 0.05 compared with PMA-treated SCi cells. (E-H) Levels of soluble pro-inflammatory cytokines in PMA-treated NRF2i U937 cells. SCi and NRF2i U937 cells were incubated with vehicle (ethanol) or PMA (10 ng/mL) for 24 h, and IL-1β (E), IL-6 (F), TNFα (G), and MCP-1 (H) levels were monitored in the culture media using the Bio-Plex cytokine assay system. Data represent the means ± SD of 5–6 experiments. aP < 0.05 compared with PMA-treated SCi cells.
Fig 3
Fig 3. Levels of ROS in NRF2i U937 cells.
(A) Cellular level of ROS was monitored in SCi and NRF2i cells. Carboxy-H2DCFDA was incubated with cells and its fluorescent intensity was quantified using a fluorocytometry analysis. (B) ROS levels were determined in PMA-treated U937 with a fluorocytometry. PMA (10 ng/ml) was incubated for 24 h and cellular ROS were monitored following DCFDA incubation. (C-E) Transcript levels for NQO1 (C), GCLM (D), and HO-1 (E) were quantified in SCi and NRF2i U937 cells following PMA (2.5 and 10 ng/mL) incubation for 24 h. Data represent the means ± SD of 3–4 experiments. aP < 0.05 compared with PMA-treated SCi cells.
Fig 4
Fig 4. Levels of cellular Ca2+ and PKCα in NRF2i U937 cells.
(A) Levels of ER stress markers in SCi and NRF2i U937 cells. Protein levels of phosphorylated PERK and EIF2α were assessed using a western blot analysis. Levels for un-spliced and spliced XBP-1 mRNA were quantified in SCi and NRF2i using RT-PCR analysis. (B) Cellular level of Ca2+ was monitored in SCi and NRF2i U937 cells. Cells were incubated with Fluo-4 AM (2 μM) for 30 min. Five min after the addition of vehicle (ethanol) or PMA (10 ng/mL), green fluorescence from Ca2+-reacting dye was monitored. The fluorescent intensity was quantified using the ZEN software. A confocal microscopic observation was performed with 400× magnification following 4',6-diamidino-2-phenylindole (DAPI) nuclear staining. Data represent the means ± SD of 3–4 experiments. aP < 0.05 compared with the vehicle control of each cell line. bP < 0.05 compared with PMA-treated SCi cells. (C) Western blot analysis of PKCα was performed in SCi and NRF2i U937 cells following PMA (10 ng/mL) incubation for 30 min. Similar blots were obtained in three independent experiments. (D) Immunocytochemical analysis of PKCα. SCi and NRF2i cells were incubated with vehicle (ethanol) or PMA (10 ng/mL) for 24 h, and PKCα cellular level was assessed following antibody incubation. A confocal microscopic observation was performed with 400× magnification following DAPI nuclear staining.
Fig 5
Fig 5. Effect of NFκB inhibition on PMA-stimulated NRF2i cell differentiation.
(A) Immunocytochemical analysis of NFκB p50. SCi and NRF2i U937 cells were incubated with vehicle (ethanol) or PMA for 6 h, and levels of p50 were determined using confocal microscopic observation (400× magnification). Nuclear staining was performed following PI incubation. The bar graph represents p50 nuclear levels. (B) Protein levels of p50 and IκB were determined by western blot. (C-D) The cells were incubated with the NFκB inhibitor BAY11-4082 (BAY, 10 nM) or BAY+PMA for 24 h. Transcript levels for IL-1β (C) and IL-6 (D) were determined using RT-PCR analysis. Data represent the means ± SD of 3 experiments. aP < 0.05 compared with PMA-treated SCi. bP < 0.05 compared with PMA-treated NRF2i.
Fig 6
Fig 6. Effect of ERK inhibition on PMA-stimulated NRF2i differentiation.
(A) Protein levels of phosphorylated ERK1/2 and total ERK1/2 were determined by western blot. SCi and NRF2i cells were incubated with PMA (10 ng/mL) for 30 min. (B-C) ERK1/2 inhibitor PD98059 (PD, 30 nM) was added to the cells for 24 h. Transcript levels for IL-1β (B) and IL-6 (C) were determined using RT-PCR analysis. Data represent the means ± SD of 3 experiments. aP < 0.05 compared with PMA-treated SCi. bP < 0.05 compared with PMA-treated NRF2i
Fig 7
Fig 7. A hypothetical model of pro-inflammatory macrophage differentiation of NRF2i U937 cells.
Low level of NRF2 facilitates U937 differentiation into pro-inflammatory macrophages. The NRF2-silenced U937 cells retain increased ROS and ER homeostatic disturbance, which are presumably resulting in elevated cellular Ca2+ and PKCα levels. Hence the PMA-stimulated PKCα activation is amplified in these knockdown cells, leading to accelerated macrophage differentiation via ERK1/2-NFκB signaling pathway.

References

    1. Geissmann F, Manz MG, Jung S, Sieweke MH, Merad M, Ley K. Development of monocytes, macrophages, and dendritic cells. Science (New York, NY). 2010;327(5966):656–61. Epub 2010/02/06. 10.1126/science.1178331 ; PubMed Central PMCID: PMCPmc2887389. - DOI - PMC - PubMed
    1. Ingersoll MA, Platt AM, Potteaux S, Randolph GJ. Monocyte trafficking in acute and chronic inflammation. Trends in immunology. 2011;32(10):470–7. Epub 2011/06/15. 10.1016/j.it.2011.05.001 ; PubMed Central PMCID: PMCPmc3179572. - DOI - PMC - PubMed
    1. Brune B, Dehne N, Grossmann N, Jung M, Namgaladze D, Schmid T, et al. Redox control of inflammation in macrophages. Antioxidants & redox signaling. 2013;19(6):595–637. Epub 2013/01/15. 10.1089/ars.2012.4785 ; PubMed Central PMCID: PMCPmc3718318. - DOI - PMC - PubMed
    1. Gordon S, Taylor PR. Monocyte and macrophage heterogeneity. Nature reviews Immunology. 2005;5(12):953–64. Epub 2005/12/03. 10.1038/nri1733 . - DOI - PubMed
    1. Lawrence T, Natoli G. Transcriptional regulation of macrophage polarization: enabling diversity with identity. Nature reviews Immunology. 2011;11(11):750–61. Epub 2011/10/26. 10.1038/nri3088 . - DOI - PubMed

Publication types

MeSH terms