Structural Characterization of Single-Stranded DNA Monolayers Using Two-Dimensional Sum Frequency Generation Spectroscopy
- PMID: 26222775
- PMCID: PMC6235446
- DOI: 10.1021/acs.jpcb.5b07078
Structural Characterization of Single-Stranded DNA Monolayers Using Two-Dimensional Sum Frequency Generation Spectroscopy
Abstract
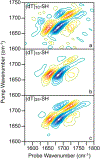
DNA-covered materials are important in technological applications such as biosensors and microarrays, but obtaining structural information on surface-bound biomolecules is experimentally challenging. In this paper, we structurally characterize single-stranded DNA monolayers of poly(thymine) from 10 to 25 bases in length with an emerging surface technique called two-dimensional sum frequency generation (2D SFG) spectroscopy. These experiments are carried out by adding a mid-IR pulse shaper to a femtosecond broad-band SFG spectrometer. Cross peaks and 2D line shapes in the 2D SFG spectra provide information about structure and dynamics. Because the 2D SFG spectra are heterodyne detected, the monolayer spectra can be directly compared to 2D infrared (2D IR) spectra of poly(thymine) in solution, which aids interpretation. We simulate the 2D SFG spectra using DFT calculations and an excitonic Hamiltonian that relates the molecular geometry to the vibrational coupling. Intrabase cross peaks help define the orientation of the bases and interbase cross peaks, created by coupling between bases, and resolves features not observed in 1D SFG spectra that constrain the relative geometries of stacked bases. We present a structure for the poly(T) oligomer that is consistent with the 2D SFG data. These experiments provide insight into the DNA monolayer structure and set precedent for studying complex biomolecules on surfaces with 2D SFG spectroscopy.
Figures


Similar articles
-
Two-dimensional sum-frequency generation reveals structure and dynamics of a surface-bound peptide.J Am Chem Soc. 2014 Jan 22;136(3):956-62. doi: 10.1021/ja408682s. Epub 2014 Jan 8. J Am Chem Soc. 2014. PMID: 24372101 Free PMC article.
-
Two-dimensional sum-frequency generation (2D SFG) spectroscopy: summary of principles and its application to amyloid fiber monolayers.Faraday Discuss. 2015;177:493-505. doi: 10.1039/c4fd00173g. Faraday Discuss. 2015. PMID: 25611039 Free PMC article.
-
Adding a dimension to the infrared spectra of interfaces using heterodyne detected 2D sum-frequency generation (HD 2D SFG) spectroscopy.Proc Natl Acad Sci U S A. 2011 Dec 27;108(52):20902-7. doi: 10.1073/pnas.1115055108. Epub 2011 Dec 5. Proc Natl Acad Sci U S A. 2011. PMID: 22143772 Free PMC article.
-
Ultrafast nonlinear coherent vibrational sum-frequency spectroscopy methods to study thermal conductance of molecules at interfaces.Acc Chem Res. 2009 Sep 15;42(9):1343-51. doi: 10.1021/ar9000197. Acc Chem Res. 2009. PMID: 19388671 Review.
-
Interface-specific ultrafast two-dimensional vibrational spectroscopy.Acc Chem Res. 2009 Sep 15;42(9):1332-42. doi: 10.1021/ar900016c. Acc Chem Res. 2009. PMID: 19441810 Review.
Cited by
-
Beyond the "spine of hydration": Chiral SFG spectroscopy detects DNA first hydration shell and base pair structures.J Chem Phys. 2024 Sep 7;161(9):095104. doi: 10.1063/5.0220479. J Chem Phys. 2024. PMID: 39230381
-
Effects of Experimental Conditions on the Signaling Fidelity of Impedance-Based Nucleic Acid Sensors.Anal Chem. 2021 Jan 19;93(2):812-819. doi: 10.1021/acs.analchem.0c03269. Epub 2021 Jan 4. Anal Chem. 2021. PMID: 33395261 Free PMC article.
-
Determination of protein conformation and orientation at buried solid/liquid interfaces.Chem Sci. 2023 Feb 14;14(11):2999-3009. doi: 10.1039/d2sc06958j. eCollection 2023 Mar 15. Chem Sci. 2023. PMID: 36937592 Free PMC article.
-
Watching Proteins Wiggle: Mapping Structures with Two-Dimensional Infrared Spectroscopy.Chem Rev. 2017 Aug 23;117(16):10726-10759. doi: 10.1021/acs.chemrev.6b00582. Epub 2017 Jan 6. Chem Rev. 2017. PMID: 28060489 Free PMC article. Review.
-
Revealing the Relationship between Electric Fields and the Conformation of Oxytocin Using Quasi-Static Amide-I Two-Dimensional Infrared Spectra.ACS Omega. 2022 Jan 19;7(4):3758-3767. doi: 10.1021/acsomega.1c06600. eCollection 2022 Feb 1. ACS Omega. 2022. PMID: 35128284 Free PMC article.
References
-
- Drummond TG; Hill MG; Barton JK Electrochemical DNA Sensors. Nat. Biotechnol 2003, 21, 1192–1199. - PubMed
-
- Ramsay G DNA Chips: State-of-the Art. Nat. Biotechnol 1998, 16, 40–44. - PubMed
-
- Epstein JR; Biran I; Walt DR Fluorescence-Based Nucleic Acid Detection and Microarrays. Anal. Chim. Acta 2002, 469, 3–36.
-
- Stoughton RB Applications of DNA Microarrays in Biology. Annu. Rev. Biochem 2005, 74, 53–82. - PubMed
-
- Zhang X; Yadavalli VK Functional Self-Assembled DNA Nanostructures for Molecular Recognition. Nanoscale 2012, 4, 2439–2446. - PubMed
Publication types
MeSH terms
Substances
Grants and funding
LinkOut - more resources
Full Text Sources
Other Literature Sources

