

A2E and lipofuscin distributions in macaque retinal pigment epithelium are similar to human
- PMID: 26223373
- PMCID: PMC4589511
- DOI: 10.1039/c5pp00170f
A2E and lipofuscin distributions in macaque retinal pigment epithelium are similar to human
Abstract
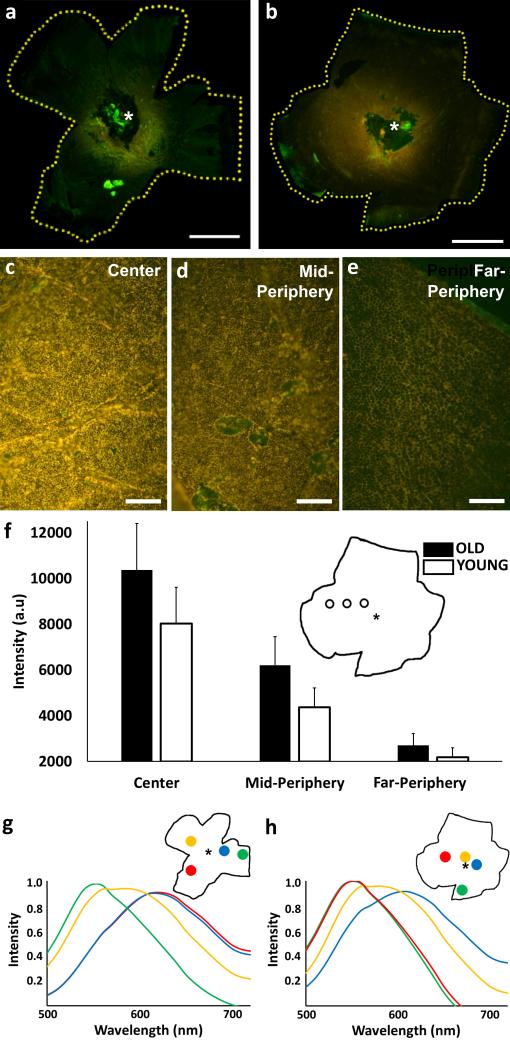
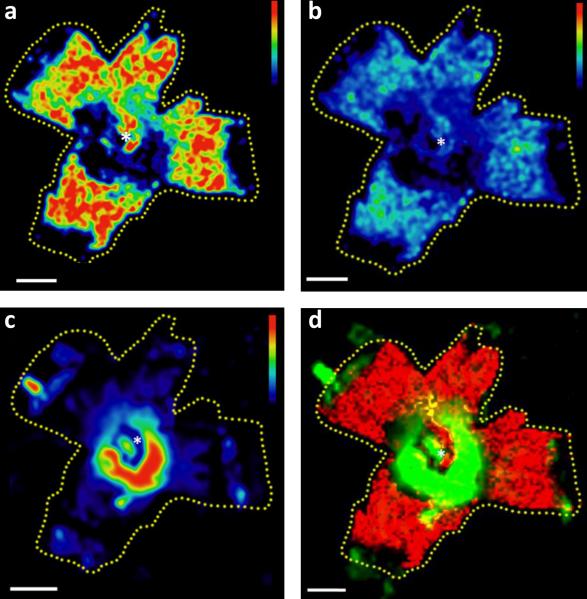
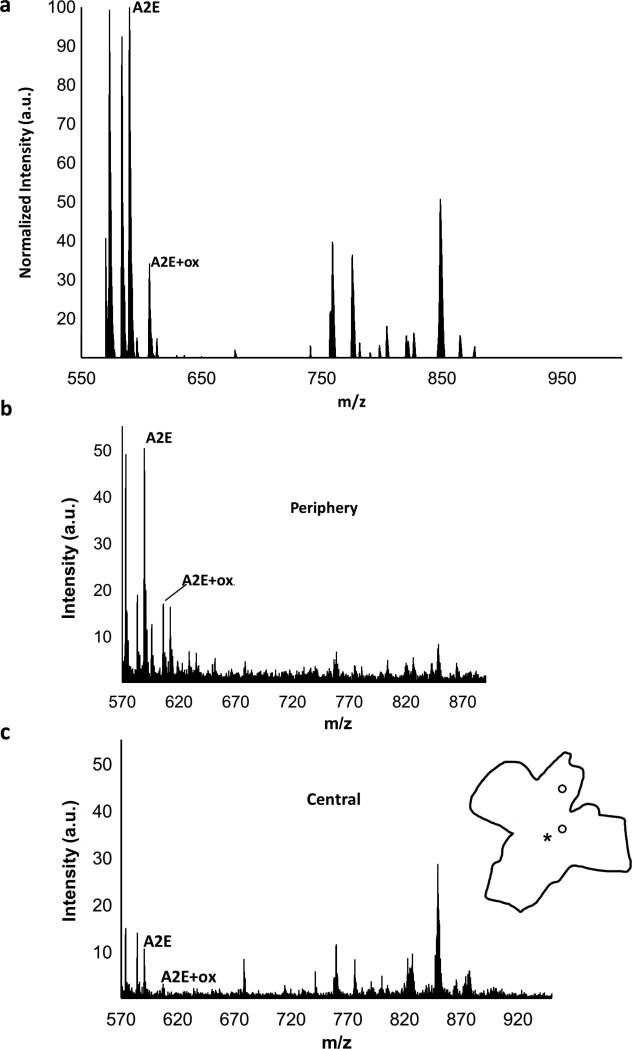
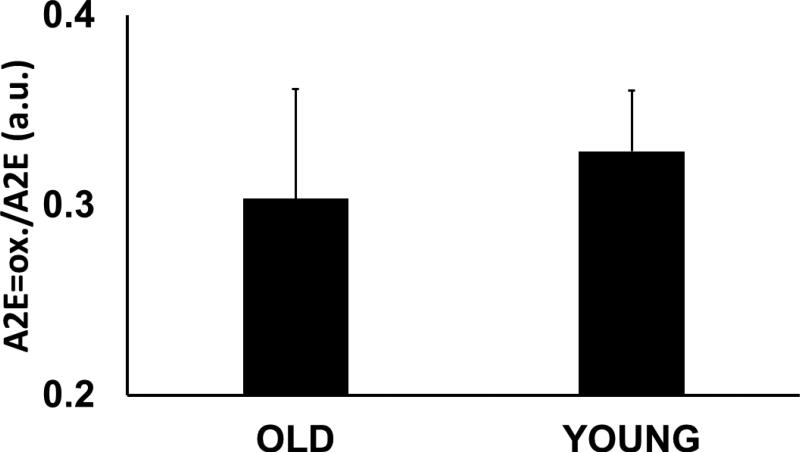
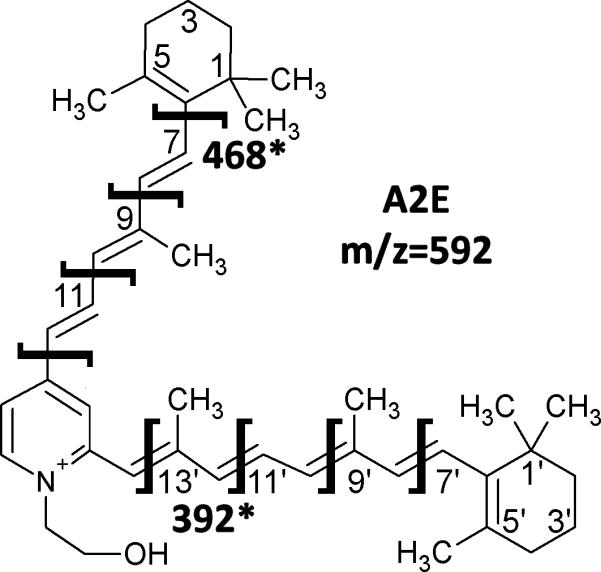
The accumulation of lipofuscin, an autofluorescent aging marker, in the retinal pigment epithelium (RPE) has been implicated in the development of age-related macular degeneration (AMD). Lipofuscin contains several visual cycle byproducts, most notably the bisretinoid N-retinylidene-N-retinylethanolamine (A2E). Previous studies with human donor eyes have shown a significant mismatch between lipofuscin autofluorescence (AF) and A2E distributions. The goal of the current project was to examine this relationship in a primate model with a retinal anatomy similar to that of humans. Ophthalmologically naive young (<10 years., N = 3) and old (>10 years., N = 4) Macaca fascicularis (macaque) eyes, were enucleated, dissected to yield RPE/choroid tissue, and flat-mounted on indium-tin-oxide-coated conductive slides. To compare the spatial distributions of lipofuscin and A2E, fluorescence and mass spectrometric imaging were carried out sequentially on the same samples. The distribution of lipofuscin fluorescence in the primate RPE reflected previously obtained human results, having the highest intensities in a perifoveal ring. Contrarily, A2E levels were consistently highest in the periphery, confirming a lack of correlation between the distributions of lipofuscin and A2E previously described in human donor eyes. We conclude that the mismatch between lipofuscin AF and A2E distributions is related to anatomical features specific to primates, such as the macula, and that this primate model has the potential to fill an important gap in current AMD research.
Figures
References
-
- Porta EA. Pigments in aging: an overview. Annals of the New York Academy of Sciences. 2002;959:57–65. - PubMed
-
- Nakano M, Oenzil F, Mizuno T, Gotoh S. Age-related changes in the lipofuscin accumulation of brain and heart. Gerontology. 1995;41(Suppl 2):69–79. - PubMed
-
- Feeney L. Lipofuscin and melanin of human retinal pigment epithelium. Fluorescence, enzyme cytochemical, and ultrastructural studies. Investigative ophthalmology & visual science. 1978;17:583–600. - PubMed
-
- Wing GL, Blanchard GC, Weiter JJ. The topography and age relationship of lipofuscin concentration in the retinal pigment epithelium. Investigative ophthalmology & visual science. 1978;17:601–607. - PubMed
-
- Delori FC, Dorey CK, Staurenghi G, Arend O, Goger DG, Weiter JJ. In vivo fluorescence of the ocular fundus exhibits retinal pigment epithelium lipofuscin characteristics. Investigative ophthalmology & visual science. 1995;36:718–729. - PubMed
Publication types
MeSH terms
Substances
Grants and funding
LinkOut - more resources
Full Text Sources
Other Literature Sources
Miscellaneous