. 2015 Jul 30;523(7562):617-20.
doi: 10.1038/nature14614.

Mitochondrial reticulum for cellular energy distribution in muscle

Affiliations

Mitochondrial reticulum for cellular energy distribution in muscle

Brian Glancy et al. Nature. .

Abstract

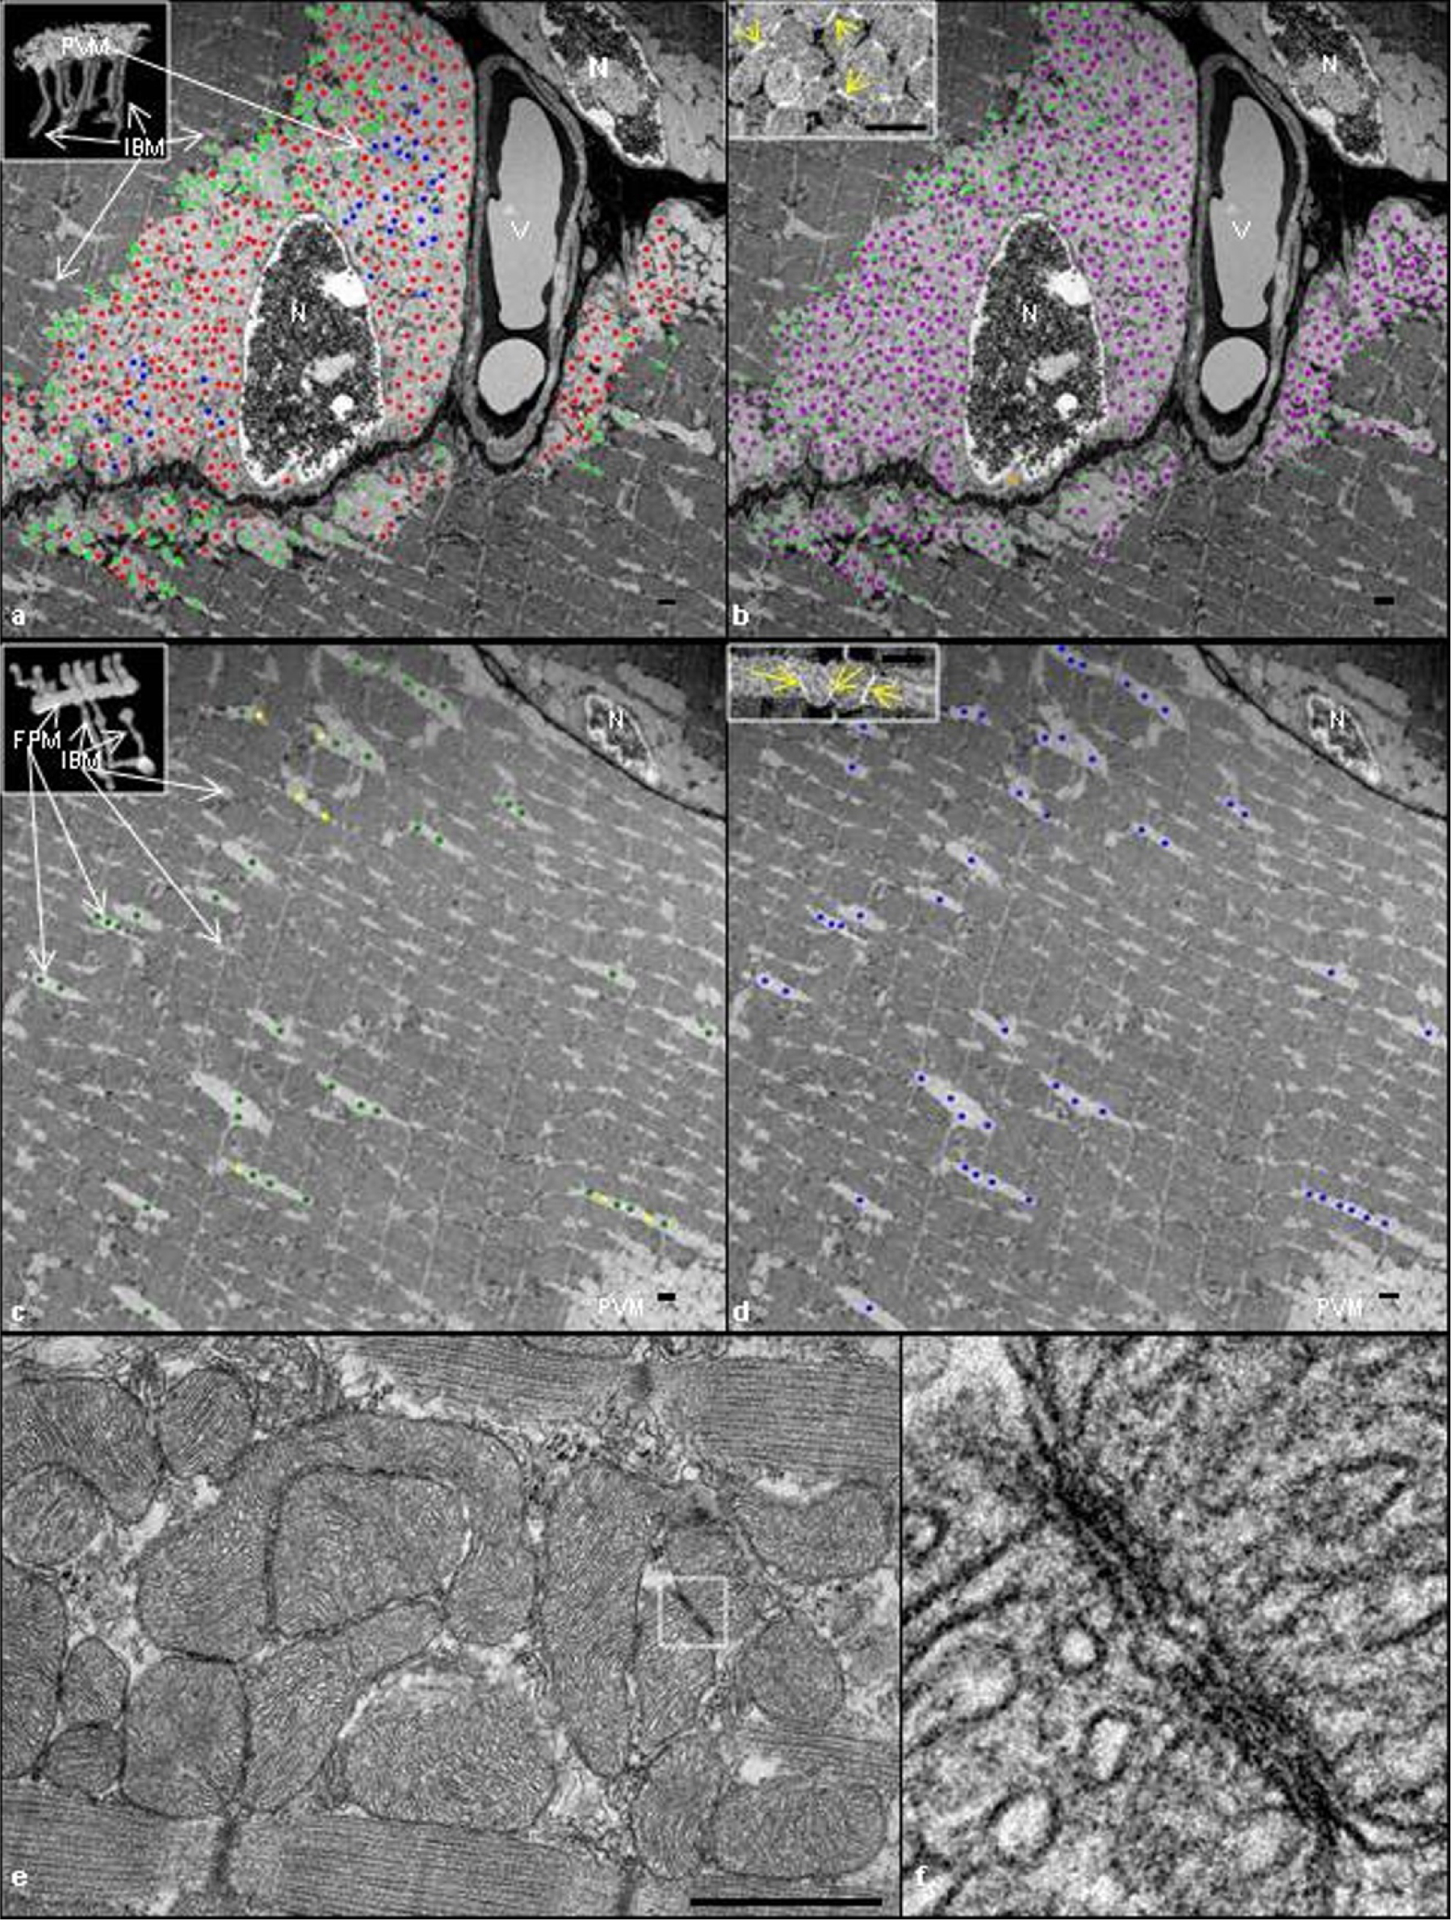
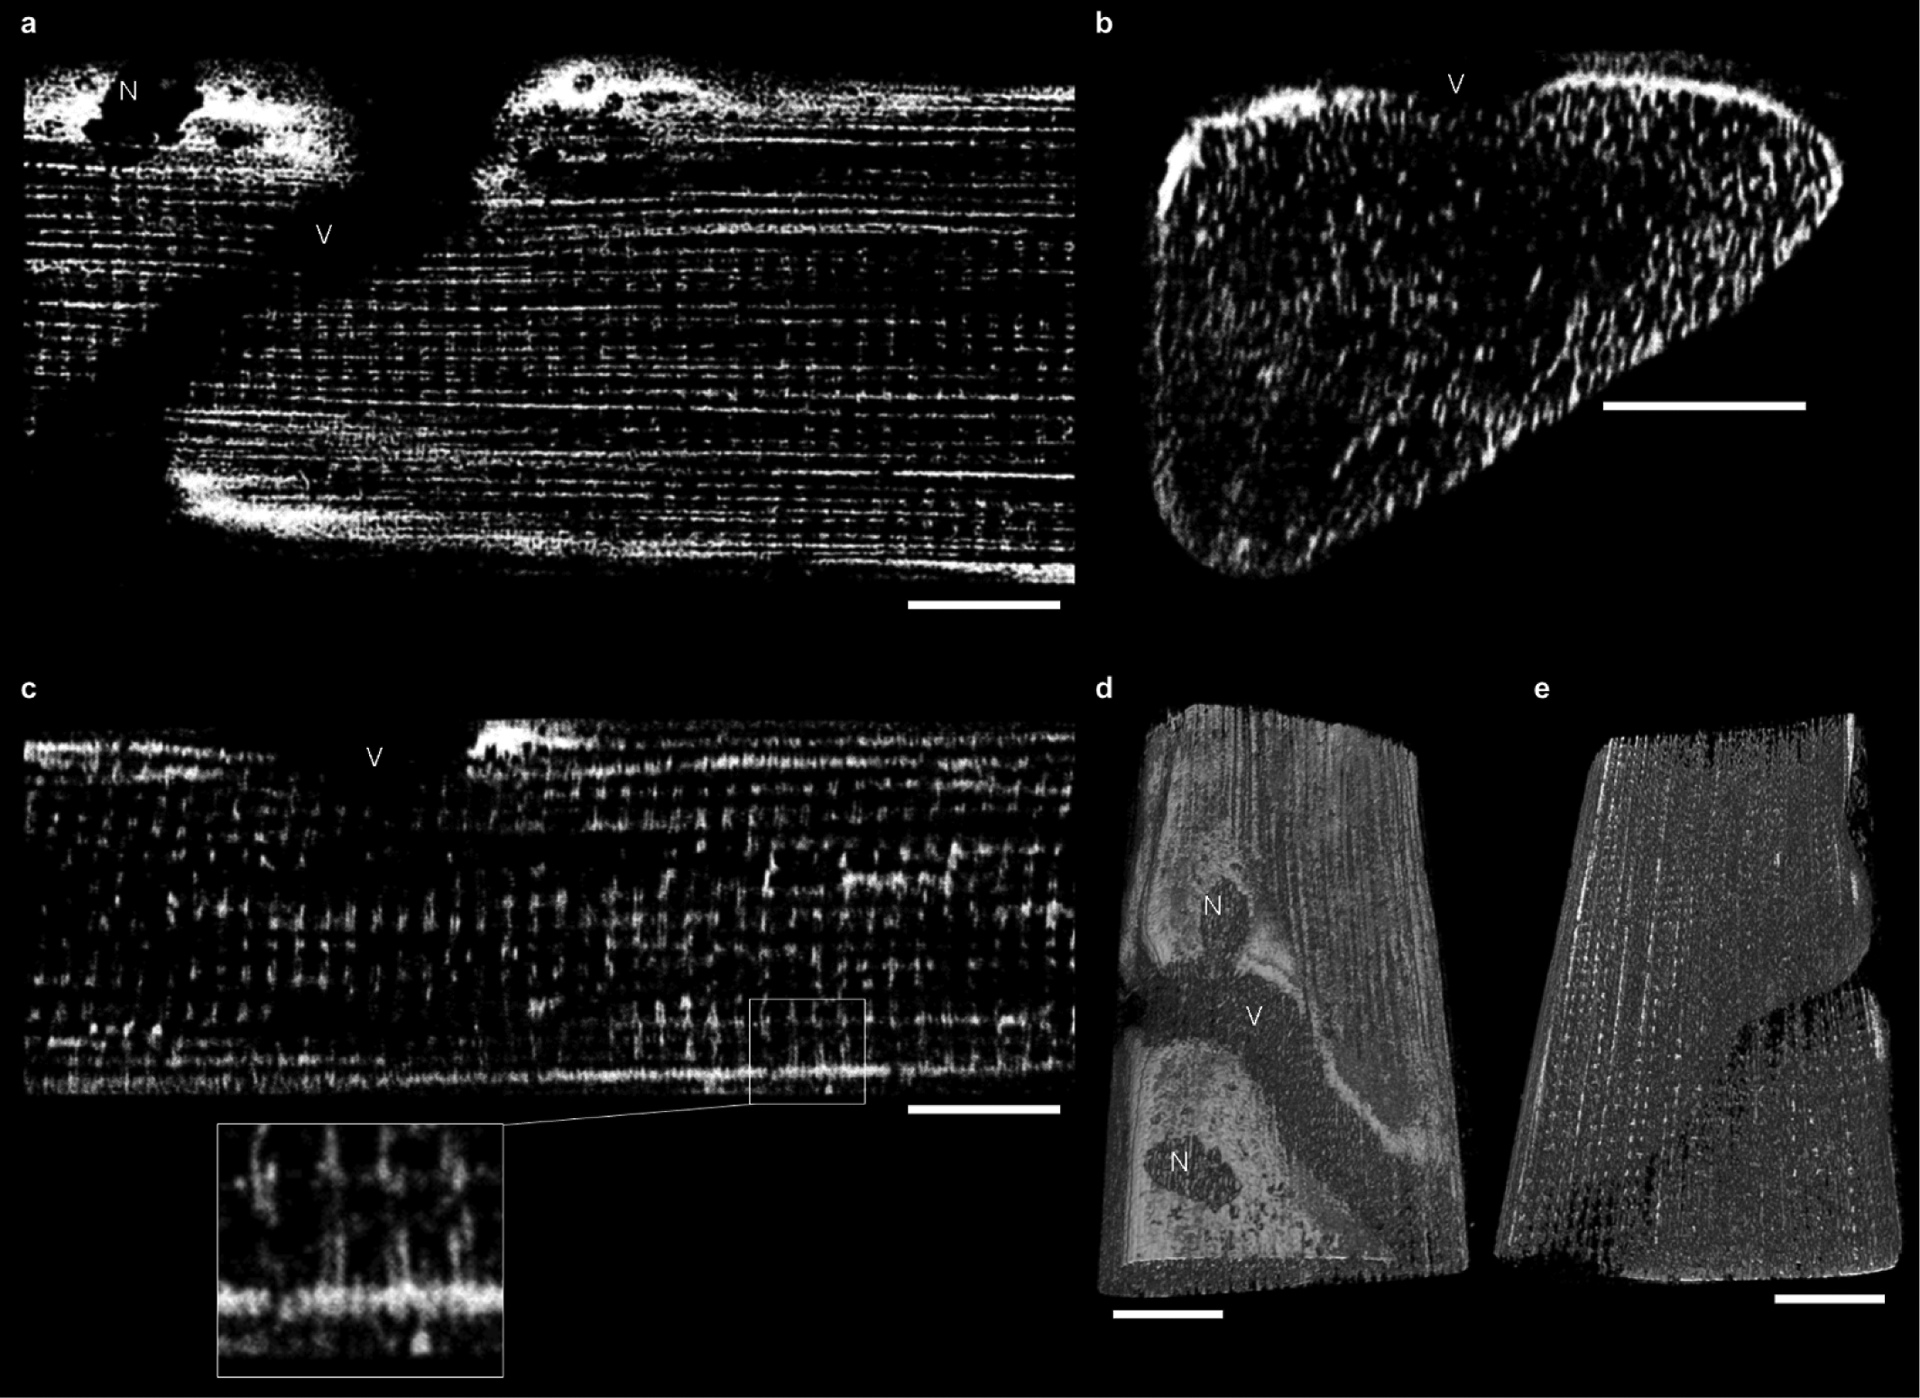
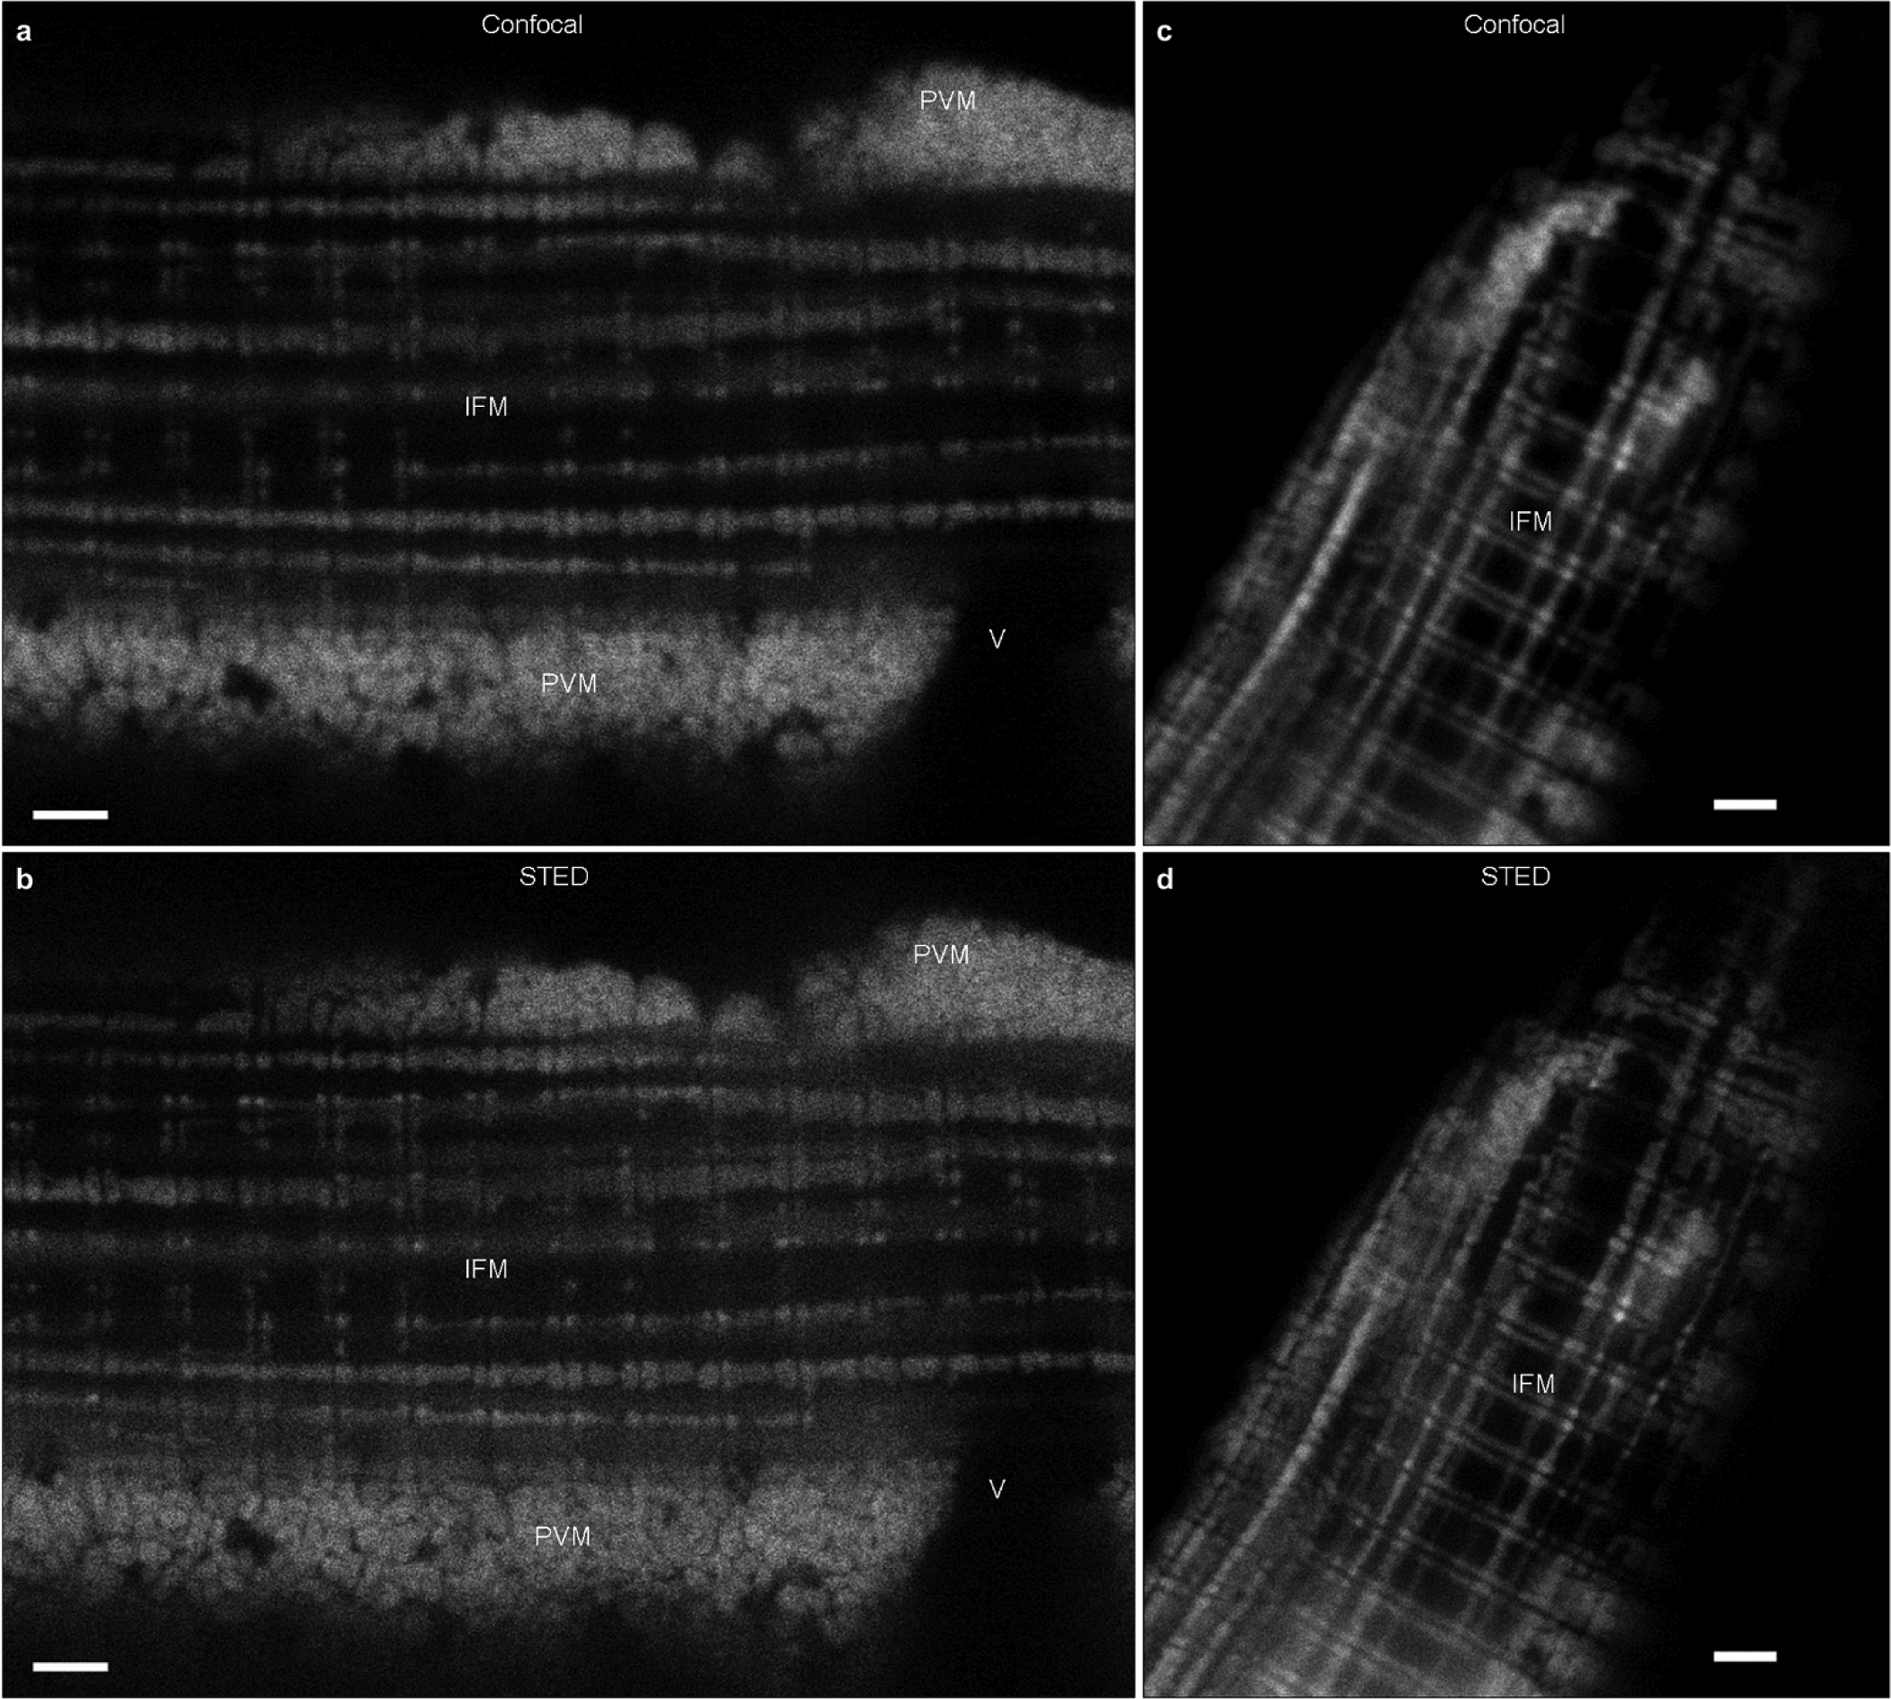
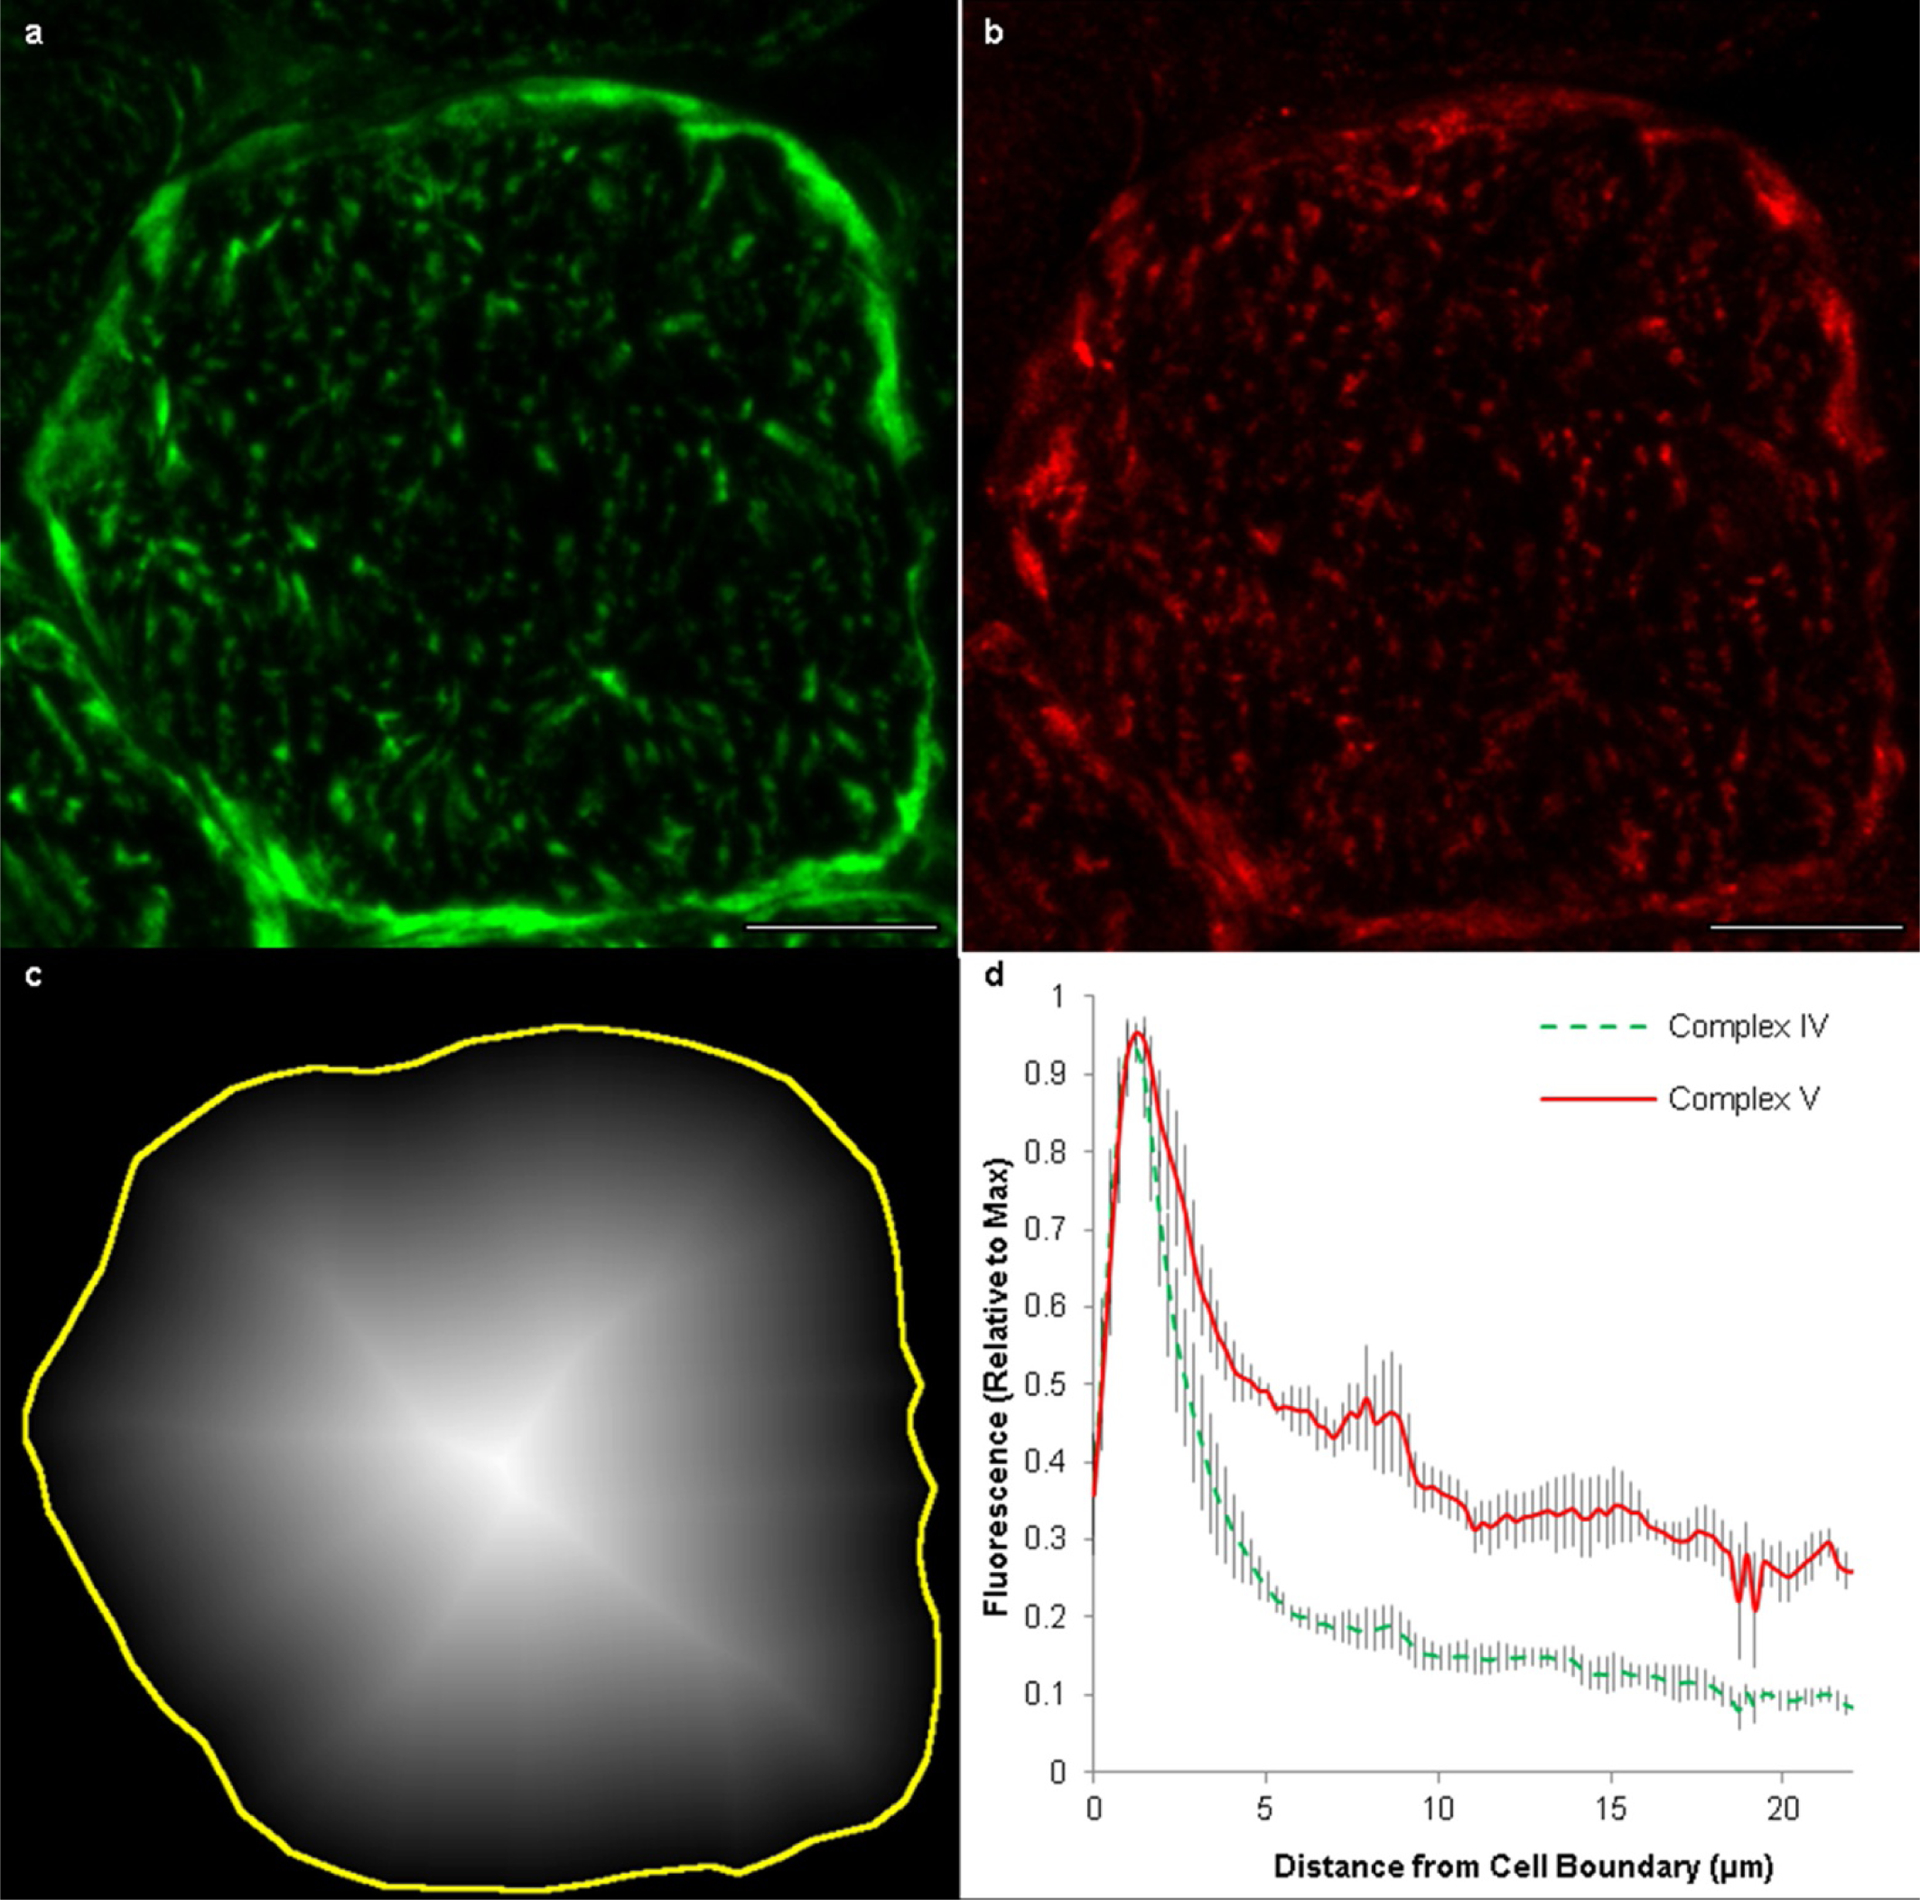
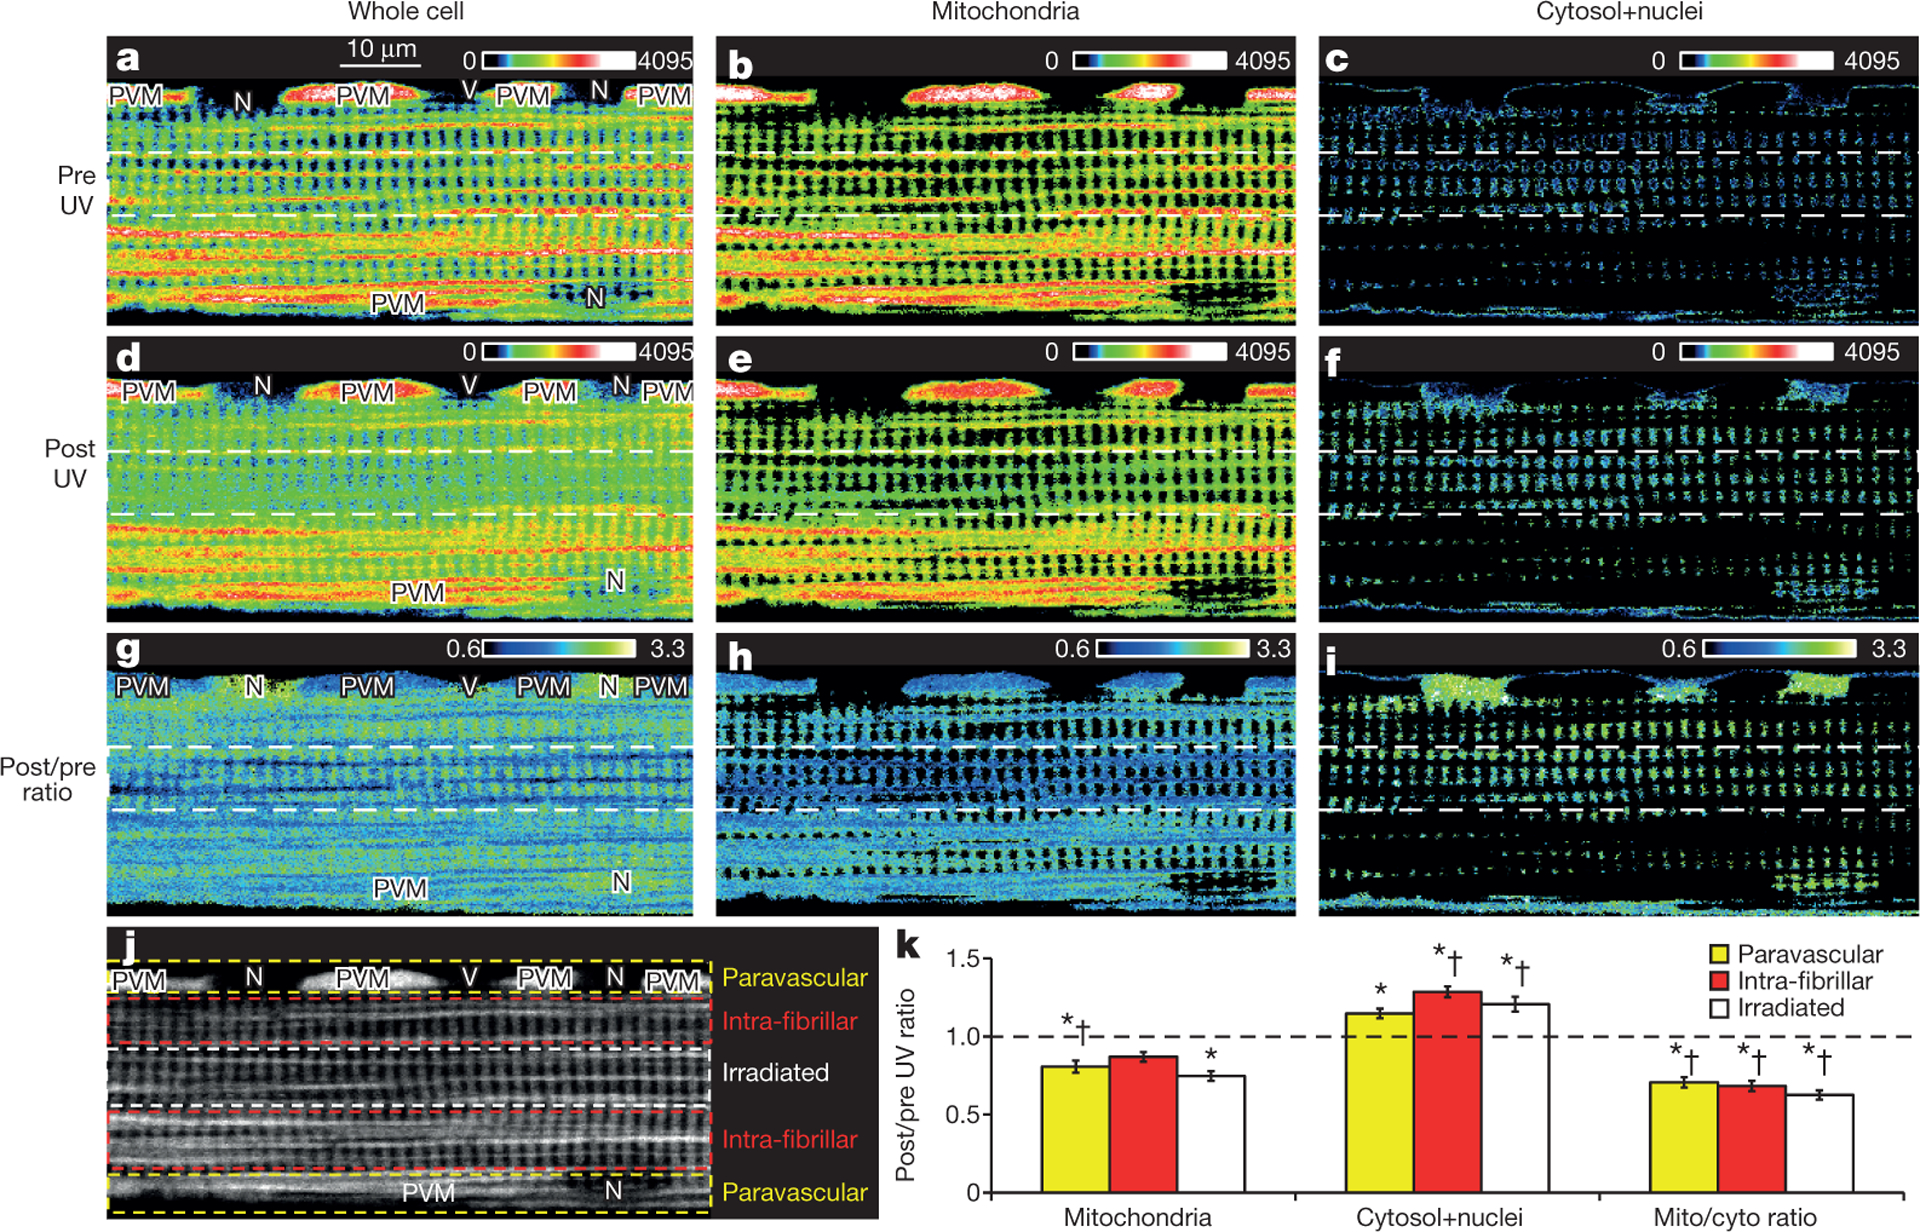
Intracellular energy distribution has attracted much interest and has been proposed to occur in skeletal muscle via metabolite-facilitated diffusion; however, genetic evidence suggests that facilitated diffusion is not critical for normal function. We hypothesized that mitochondrial structure minimizes metabolite diffusion distances in skeletal muscle. Here we demonstrate a mitochondrial reticulum providing a conductive pathway for energy distribution, in the form of the proton-motive force, throughout the mouse skeletal muscle cell. Within this reticulum, we find proteins associated with mitochondrial proton-motive force production preferentially in the cell periphery and proteins that use the proton-motive force for ATP production in the cell interior near contractile and transport ATPases. Furthermore, we show a rapid, coordinated depolarization of the membrane potential component of the proton-motive force throughout the cell in response to spatially controlled uncoupling of the cell interior. We propose that membrane potential conduction via the mitochondrial reticulum is the dominant pathway for skeletal muscle energy distribution.


Conflict of interest statement

The authors declare no competing financial interests.

Figures

Extended Data Figure 1 |
Extended Data Figure 1 |. Mitochondrial coupling assessment.
a, b, Single image from the middle of a FIB-SEM muscle volume including two nuclei (N) and a blood vessel (V). a, Direct coupling. PVM tagged green are those where a single mitochondrion projects from a PVM into an IBM with a continuous outer membrane (see inset) within the imaged volume. Red-tagged PVM did not project into IBM. Blue-tagged PVM continued out of the field of view and could not be classified. b, Electron-dense contact site (EDCS) coupling. Magenta-tagged mitochondria were connected by EDCS (see yellow arrows in inset). Additional green dots were added to PVM which project into IBM (see a). Greater than 99% of tracked PVM were coupled by EDCS. c, d, Single image from the middle of the intra-fibrillar region of a FIB-SEM volume. c, Direct coupling. FPM tagged green are those where a single mitochondrion projects from an FPM into an IBM with a continuous outer membrane (see inset). Yellow-tagged FPM did not project into IBM. d, EDCS coupling. FPM tagged blue were connected to an adjacent FPM through an EDCS (see yellow arrows in inset). Images are representative of 4 samples with significant paravascular and intra-fibrillar mitochondrial content from 4 animals. e, A longitudinal TEM mouse tibialis anterior muscle image showing the close association between adjacent mitochondria. f, Close up view of an EDCS highlighted in e showing the convergence of mitochondrial membranes between two adjacent mitochondria. Scale bars, 750 nm.
Extended Data Figure 2 |
Extended Data Figure 2 |. Multi-photon microscopy (MPM) images of fresh muscle fibres in situ.
a, Endogenous mitochondrial NAD(P)H signal froma single XY image within a 3D volume of a muscle fibre. In this orientation, paravascular mitochondria (PVM) are apparent as clusters around the embedded capillary (V) and nuclei (N). Fibre parallel mitochondria (FPM) are seen as horizontal lines while I-band mitochondria (IBM) are seen as discrete spots. There are very few vertical lines in this image due to the infrequency of cross-fibre connection mitochondria (CFCM). The full volume can be seen in Supplementary Video 3. b, A YZ image from the same fibre volume asin a. PVM appear lateral to the embedded capillary (V), while IBM appear as vertical lines and FPM are seen as discrete spots. Note the lack of horizontal lines (CFCM) in this image or the accompanying video (Supplementary Video 4). c, An XZ image of the same muscle volume as in a and b. PVM are located on the cell periphery; IBM are seen as vertical lines; FPM are seen as horizontal lines; and CFCM as discrete spots. In the inset, pairs of IBM projecting out from PVM are highlighted. d, A 3D rendering of the endogenous mitochondrial NAD(P)H signal within the muscle fibre shown in ac. 360° views of this 3D rendering are shown in Supplementary Video 5. e, A viewof the interior of the 3D rendering from d showing the regularity of the mitochondrial network within skeletal muscle. The field of view for the muscle volume in this image is 102.4 × 51.2 × 36.8 μm in x, y and z, respectively. Scale bars, 15 μm. Mean fibre volume from these MPM images was 159,431 ± 15,507 μm3. Images are representative of 4 fibres from 3 mice.
Extended Data Figure 3 |
Extended Data Figure 3 |. Super resolution microscopy allows improved visualization of individual mitochondria.
a, Single confocal microscopy image of an isolated muscle fibre loaded with mitochondrial membrane potential dye, TMRM. PVM, paravascular mitochondria; IFM, intra-fibrillar mitochondria; V, vessel. b, Single stimulated emission depletion (STED) microscopy image of the same fibre as in a. c, The average of a confocal microscopy image stack of a TMRM loaded isolated muscle fibre. d, The average of a STED microscopy image stack of the same fibre as in c. For c and d, image volume was 24.30 × 27.47 × 1.75 μm in x, y and z, and images shown are the average of 9 images taken with 219 nm z-steps. Confocal imageswere acquired before STED images at each image depth. All images were acquired with x and y pixel sizes of 30 nm. Scale bars, 2 μm. As most muscle mitochondria are larger than 300 nm, the improved resolution with STED is primarily noted by the increased clarity of the spaces between individual mitochondria, particularly the PVM. Images are representative of 13 fibres from 3 mice.
Extended Data Figure 4 |
Extended Data Figure 4 |. Complex V expression is relatively higher than complex IV in the muscle fibre interior.
a, Representative confocal microscopy image of a cross-section of a muscle fibre immunostained for complex IV. b, The same muscle section depicted in a immunostained for complex V. Scale bars, 15 μm. All images analysis was performed on the raw images. Brightness and contrast have been increased for the images shown here to improve presentation. c, Distance map from the boundary of the cell (yellow line) towards the interior of the fibre where image intensity corresponds to distance from the cell boundary. The mean fluorescence signal for all pixels of a given distance from the cell boundary was assessed for both complex IV and complex V. Images representative of 4 fibres from 4 mice. d, Results from intensity profile analysis of 4 muscle fibres from 4 animals show relatively increased complex V in the fibre interior or, conversely, relatively higher complex IV near the fibre periphery. The red, solid line shows the mean intensity profile for complex V from the outside to the inside of the fibre. The green, dotted line shows the mean intensity profile for complex IV from the outside to the inside of the fibre. Values are normalized to the maximal intensity from each intensity profile to allow comparison of images of varying intensities. Grey shading around each line shows the standard error.
Extended Data Figure 5 |
Extended Data Figure 5 |. Primary antibody specificity.
a, Coomassie-stained CN-PAGE gel after transferring isolated mouse skeletal muscle mitochondrial proteins to PVDF membrane for western blotting. Mitochondrial oxidative phosphorylation complexes I–V can be resolved as individual bands. b, Western blot dual immunostained for complex V, β-subunit (upper band), and complex IV, subunit I (lower band), with the same primary antibodies as used for the muscle section dual immunostaining as shown in Fig. 3 and Extended Data Fig. 4.
Extended Data Figure 6 |
Extended Data Figure 6 |. Sarcolemmal capillary grooves remain even after removal of capillaries.
a, Longitudinal view of a 3D rendering of the outer 10 μm of an enzymatically isolated muscle fibre imaged as the mitochondrial TMRM signal by confocal microscopy. Blood vessels (V) and nuclei (N) are apparent as negative signals. b, c, Rotation of the volume in a around the longitudinal (b) and cross-sectional (c) axes reveals the grooves in the sarcolemma where capillaries were once present. Scale bars, 10 μm. Images representative of 11 fibres from 4 mice.
Extended Data Figure 7 |
Extended Data Figure 7 |. Additional analyses of mitochondrial membrane potential conduction.
a, Confocal image of an isolated muscle fibre loaded with TMRM showing regions chosen for representative line profile analysis. Images are representative of 11 fibres from 4 mice. b, Line profile of TMRM fluorescence in the PVM+nuclear (N) region of the cell (marked by yellow dotted lines in a) before and after activation of MitoPhotoDNP shows a decrease in PVM signal, increase in N signal, and no change outside of the cell where a blood vessel (V) was located before enzymatic fibre isolation. c, Line profile of TMRM fluorescence in the region of the cell irradiated with UV light (irradiated, marked by white dotted lines in a) showing a decrease in mitochondrial signal (peaks) and an increase in cytosolic signal (troughs) after MitoPhotoDNP activation. d, Line profile of TMRM fluorescence in the non-irradiated IFM region of the cell (intra-fibrillar, marked by red dotted lines in a) showing a decrease in mitochondrial signal (peaks) and an increase in cytosolic signal (troughs) after MitoPhotoDNP activation. c and d take advantage of the regular pattern of IBM and cytosol in the intra-fibrillar space. However, any FPM in the regions selected for analysis may confound these results. A more robust analysis that selects only the IBM is shown in e and f. e, Representative fast Fourier transform (FFT) power spectrum of IFM TMRM signal reveals a 61 ± 3% decrease (n = 9 experiments) in the amplitude of IBM component (0.5 μm−1 frequency) after MitoPhotoDNP activation. Inset: log scale full FFT power spectrum. f, Representative FFT analyses of IFM mitochondria reveals no change (pre/post = 1.0 ± 0.03, n = 5 experiments) in the TMRM amplitude of IBM (0.5 μm−1 frequency) after UV exposure when MitoPhotoDNP is not present. Inset: log scale full FFT power spectrum.
Extended Data Figure 8 |
Extended Data Figure 8 |. Effect of UV exposure on membrane potential without MitoPhotoDNP.
a, Representative heat map image of an isolated mouse soleus muscle fibre loaded with 5 nM TMRM. N, nucleus; V, vessel. b, c, Image from a thresholded to include only the TMRM signal in the mitochondria (b) or cytosol+nuclei (c). df, Whole cell (d), mitochondrial (e) and cytosolic+nuclear (f) TMRM signals immediately after UV exposure in the centre region of the cell (outlined by the white dotted lines). gi, Post/pre ratiometric whole-cell (g), mitochondrial (h), and cytosolic+nuclear (i) TMRM images showing little change outside of the UV-exposed area. j, Greyscale image of a highlighting the different cell regions used for quantitative analysis. All pixels were analysed. k, TMRM signal decreased in both the mitochondria and cytosol in the UV-exposed region indicative of slight photobleaching. Images are representative of 10 fibres from 3 mice. Data represent the mean ± s.e. from 10 experiments from 3 animals. Asterisk indicates significantly different (ANOVA, P < 0.05) from a post/pre ratio of 1.0. Plus symbol indicates significantly different (P < 0.05) from IFM+UV region. See Supplementary Video 10 for time course video.
Extended Data Figure 9 |
Extended Data Figure 9 |. UV light was restricted to the drawn ROI.
Difference XY image of a uniformly blue fluorescent slide before and after exposure to UV light in the drawn ROI (white outline). Inset: YZ view shows that the UV light was largely maintained to the ROI drawn (black line). Scale bars, 5 μm. Images are representative of 3 experiments.
Figure 1 |
Figure 1 |. Muscle mitochondria form highly connected networks.
a, 3D surface rendering of 25.53 × 24.06 × 4.23 μm FIB-SEM volume segmented to show spatial relationships between mitochondria (green) and other structures (nucleus (N), cyan; capillary (V), magenta; red blood cell, red; myofibrils, grey). b, Removing myofibrils highlights different morphologies within intra-fibrillar mitochondrial (IFM) network. ce, Zooming in reveals projections from paravascular mitochondria (PVM) into I-band mitochondria (IBM) (c), and numerous interactions between IBM and cross-fibre connection mitochondria (CFCM) (d) and fibre parallel mitochondria (FPM) (d, e). Scale bars, 3 μm. Representative of eight separate volumes analysedfrom four animals.
Figure 2 |
Figure 2 |. Muscle mitochondrial morphologies.
a, 3D rendering of mitochondria from FIB-SEM volume. Non-white colours indicate individual mitochondria. Scale bar, 750 nm. b, PVM projecting into IBM. c, Mitochondrion showing IBM and CFCM. d, Repeating connections between IBM and FPM. e, Myofibril (grey) and associated mitochondria (green). f, FPM with IBM and CFCM branches. Dotted lines indicate z-lines. g, Deconvolved super-resolution image of TMRM-loaded myocyte. LD, lipid droplet. Insets are magnified 3× from original. h, Mean mitochondrial diameters. Error bars indicate standard error. Quantification from raw images. Significantly different from PVM (*), IBM (†), FPM (‡) (ANOVA, P < 0.05). Images represent data from: FIB-SEM, 8 fibres, 4 mice; STED, 13 fibres, 3 mice.
Figure 3 |
Figure 3 |. Capacity for membrane potential conduction.
a, 3D rendering of muscle fibre immunostained for both complex IV and complex V. Confocal image coloured according to complex IV/complex V ratio. Relatively higher complex IV, green pixels; relatively higher complex V, red pixels. Nuclei, blue. b, c, Separation of PVM around fibre periphery (b) and IFM (c) within fibre as used for calculations. d, PVM have relatively greater capacity for membrane potential generation while IFM have greater capacity for membrane potential utilization. Images are representative of data from 12 fibres, 5 mice. Error bars indicate standard error. Asterisk indicates significantly different from PVM (paired t-test, P < 0.05). Scale bars, 15 μm.
Figure 4 |
Figure 4 |. Mitochondrial membrane potential conduction.
Regional uncoupling of fibre loaded with TMRM and MitoPhotoDNP. White dotted lines indicate region of MitoPhotoDNP UV activation. ac, Pre-UV whole-cell (a), mitochondria (b) and cytosol plus nuclei (c) images. df, Post-UV whole-cell (d), mitochondria (e) and cytosol plus nuclei(f) images. gi, Post/pre-UV ratios for whole-cell (g), mitochondria (h) and cytosol plus nuclei (i). j, Cell regions. k, Near-uniform redistribution of TMRM from mitochondria to cytosol plus nuclei consistent with homogenous depolarization of all cell regions. Mean ± standard error from 11 experiments, 4 animals. Significantly different (ANOVA, P < 0.05) values are indicated for post/pre ratio of 1.0 (*), control (†) (Extended Data Fig. 8). No statistical differences between cell regions.

Comment in

References

    1. Bessman SP & Geiger PJ Transport of energy in muscle: The phosphorylcreatine shuttle. Science 211, 448–452 (1981). - PubMed
    1. Wittenberg JB Myoglobin-facilitated oxygen diffusion: Role of myoglobin in oxygen entry into muscle. Physiol. Rev 50, 559–632 (1970). - PubMed
    1. Garry DJ et al. Mice without myoglobin. Nature 395, 905–908 (1998). - PubMed
    1. van Deursen J et al. Skeletal muscles of mice deficient in muscle creatine kinase lack burst activity. Cell 74, 621–631 (1993). - PubMed
    1. Lygate CA et al. Living without creatine: unchanged exercise capacity and response to chronic myocardial infarction in creatine-deficient mice. Circ. Res 112, 945–955 (2013). - PMC - PubMed

Publication types

Substances