

A peptide resource for the analysis of Staphylococcus aureus in host-pathogen interaction studies
- PMID: 26224020
- PMCID: PMC4886865
- DOI: 10.1002/pmic.201500091
A peptide resource for the analysis of Staphylococcus aureus in host-pathogen interaction studies
Abstract
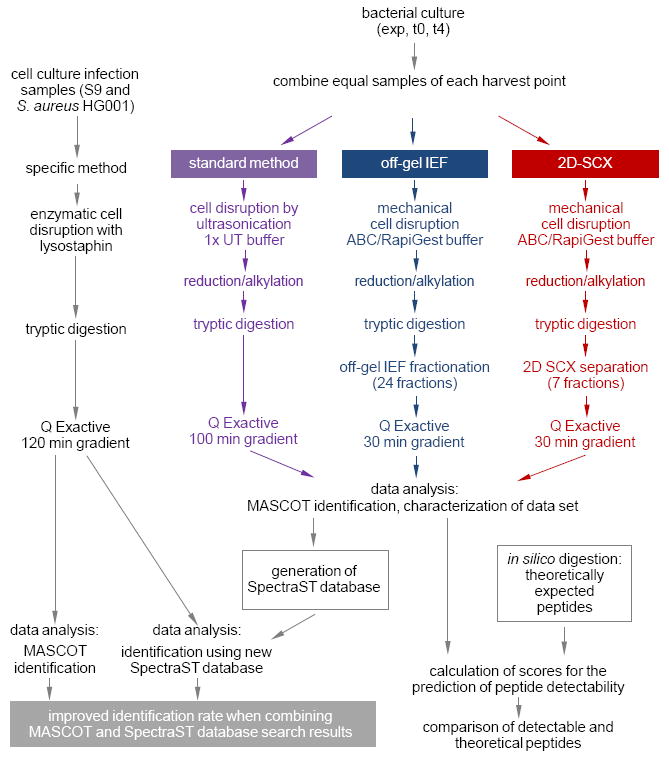
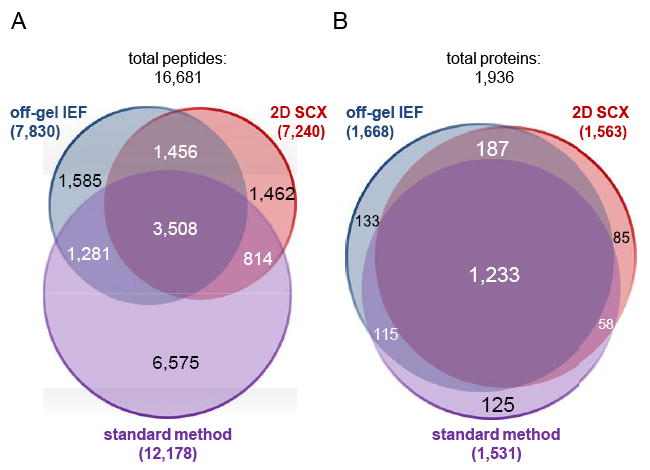
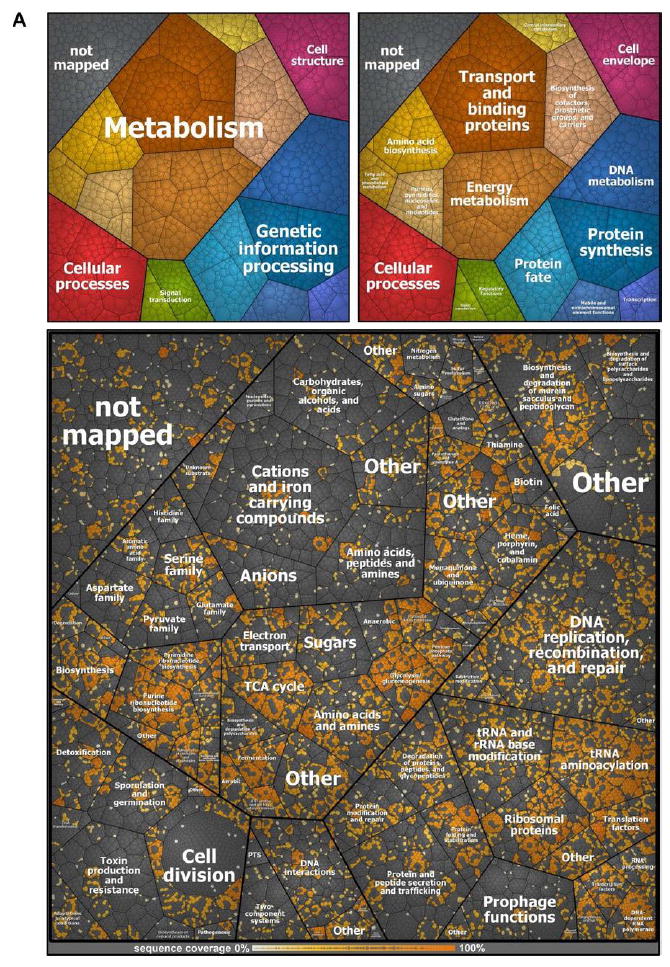
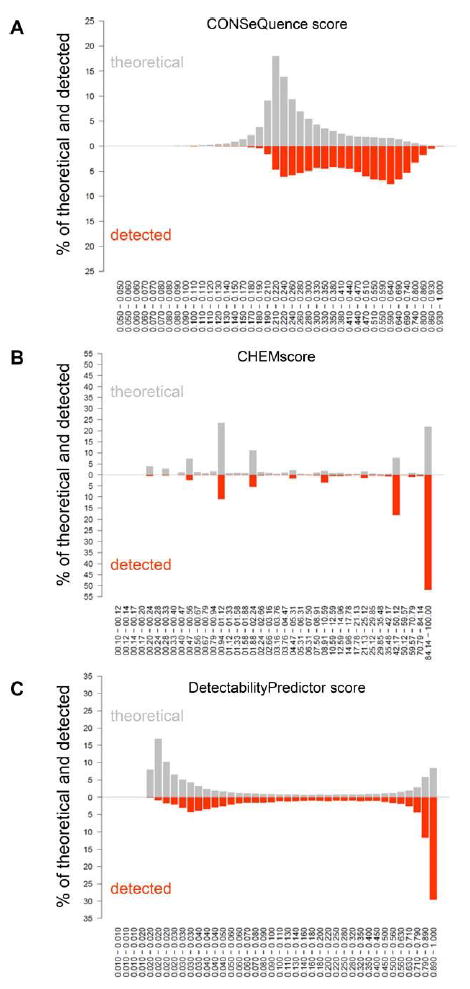
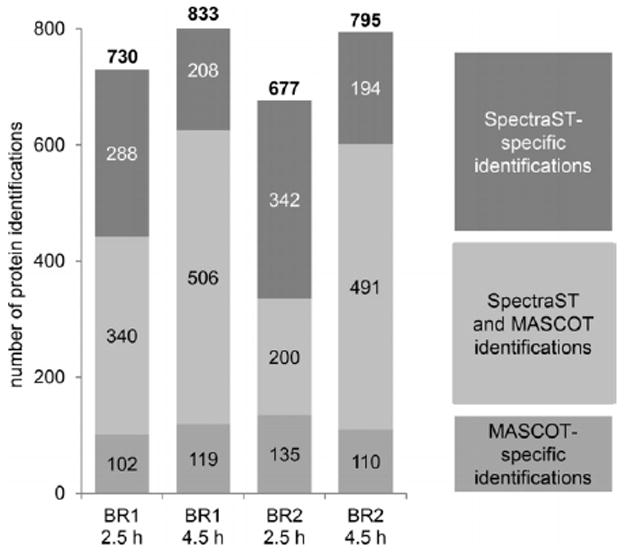
Staphylococcus aureus is an opportunistic human pathogen, which can cause life-threatening disease. Proteome analyses of the bacterium can provide new insights into its pathophysiology and important facets of metabolic adaptation and, thus, aid the recognition of targets for intervention. However, the value of such proteome studies increases with their comprehensiveness. We present an MS-driven, proteome-wide characterization of the strain S. aureus HG001. Combining 144 high precision proteomic data sets, we identified 19 109 peptides from 2088 distinct S. aureus HG001 proteins, which account for 72% of the predicted ORFs. Peptides were further characterized concerning pI, GRAVY, and detectability scores in order to understand the low peptide coverage of 8.7% (19 109 out of 220 245 theoretical peptides). The high quality peptide-centric spectra have been organized into a comprehensive peptide fragmentation library (SpectraST) and used for identification of S. aureus-typic peptides in highly complex host-pathogen interaction experiments, which significantly improved the number of identified S. aureus proteins compared to a MASCOT search. This effort now allows the elucidation of crucial pathophysiological questions in S. aureus-specific host-pathogen interaction studies through comprehensive proteome analysis. The S. aureus-specific spectra resource developed here also represents an important spectral repository for SRM or for data-independent acquisition MS approaches. All MS data have been deposited in the ProteomeXchange with identifier PXD000702 (http://proteomecentral.proteomexchange.org/dataset/PXD000702).
Keywords: Host-pathogen interactions; Mass spectrometry (MS); Microbiology; Spectral library; Staphylococcus aureus.
© 2015 WILEY-VCH Verlag GmbH & Co. KGaA, Weinheim.
Conflict of interest statement
The authors have declared no conflict of interest.
Figures
Similar articles
-
A global Staphylococcus aureus proteome resource applied to the in vivo characterization of host-pathogen interactions.Sci Rep. 2017 Sep 8;7(1):9718. doi: 10.1038/s41598-017-10059-w. Sci Rep. 2017. PMID: 28887440 Free PMC article.
-
Analysis of Staphylococcus aureus proteins secreted inside infected human epithelial cells.Int J Med Microbiol. 2018 Aug;308(6):664-674. doi: 10.1016/j.ijmm.2018.06.002. Epub 2018 Jun 18. Int J Med Microbiol. 2018. PMID: 29941384
-
Time-resolved quantitative proteome profiling of host-pathogen interactions: the response of Staphylococcus aureus RN1HG to internalisation by human airway epithelial cells.Proteomics. 2010 Aug;10(15):2801-11. doi: 10.1002/pmic.201000045. Proteomics. 2010. PMID: 20518028
-
A proteomic view of cell physiology and virulence of Staphylococcus aureus.Int J Med Microbiol. 2010 Feb;300(2-3):76-87. doi: 10.1016/j.ijmm.2009.10.006. Epub 2009 Dec 11. Int J Med Microbiol. 2010. PMID: 20005169 Review.
-
Proteomic approaches to study Staphylococcus aureus pathogenesis.J Proteomics. 2010 Feb 10;73(4):701-8. doi: 10.1016/j.jprot.2009.10.007. Epub 2009 Oct 29. J Proteomics. 2010. PMID: 19879388 Review.
Cited by
-
Metabolic Cross-talk Between Human Bronchial Epithelial Cells and Internalized Staphylococcus aureus as a Driver for Infection.Mol Cell Proteomics. 2019 May;18(5):892-908. doi: 10.1074/mcp.RA118.001138. Epub 2019 Feb 26. Mol Cell Proteomics. 2019. PMID: 30808728 Free PMC article.
-
A global Staphylococcus aureus proteome resource applied to the in vivo characterization of host-pathogen interactions.Sci Rep. 2017 Sep 8;7(1):9718. doi: 10.1038/s41598-017-10059-w. Sci Rep. 2017. PMID: 28887440 Free PMC article.
-
Characterization of Foodborne Strains of Staphylococcus aureus by Shotgun Proteomics: Functional Networks, Virulence Factors and Species-Specific Peptide Biomarkers.Front Microbiol. 2017 Dec 11;8:2458. doi: 10.3389/fmicb.2017.02458. eCollection 2017. Front Microbiol. 2017. PMID: 29312172 Free PMC article.
-
A comprehensive spectral assay library to quantify the Escherichia coli proteome by DIA/SWATH-MS.Sci Data. 2020 Nov 12;7(1):389. doi: 10.1038/s41597-020-00724-7. Sci Data. 2020. PMID: 33184295 Free PMC article.
-
Sample Preparation by Easy Extraction and Digestion (SPEED) - A Universal, Rapid, and Detergent-free Protocol for Proteomics Based on Acid Extraction.Mol Cell Proteomics. 2020 Jan;19(1):209-222. doi: 10.1074/mcp.TIR119.001616. Epub 2019 Nov 21. Mol Cell Proteomics. 2020. PMID: 31754045 Free PMC article.
References
-
- Wertheim HF, Melles DC, Vos MC, van Leeuwen W, et al. The role of nasal carriage in Staphylococcus aureus infections. Lancet Infect Dis. 2005;5:751–762. - PubMed
-
- Liu X, Hu Y, Pai PJ, Chen D, Lam H. Label-free quantitative proteomics analysis of antibiotic response in Staphylococcus aureus to oxacillin. J Proteome Res. 201413:1223–1233. - PubMed
Publication types
MeSH terms
Substances
Grants and funding
LinkOut - more resources
Full Text Sources
Other Literature Sources
Medical
Research Materials
Miscellaneous
