Review
. 2015 Oct;21(10):793-801.
doi: 10.1111/cns.12417. Epub 2015 Jul 30.

Resting-state functional brain networks in Parkinson's disease

Affiliations
Review

Resting-state functional brain networks in Parkinson's disease

Hugo C Baggio et al. CNS Neurosci Ther. 2015 Oct.

Abstract

The network approach is increasingly being applied to the investigation of normal brain function and its impairment. In the present review, we introduce the main methodological approaches employed for the analysis of resting-state neuroimaging data in Parkinson's disease studies. We then summarize the results of recent studies that used a functional network perspective to evaluate the changes underlying different manifestations of Parkinson's disease, with an emphasis on its cognitive symptoms. Despite the variability reported by many studies, these methods show promise as tools for shedding light on the pathophysiological substrates of different aspects of Parkinson's disease, as well as for differential diagnosis, treatment monitoring and establishment of imaging biomarkers for more severe clinical outcomes.

Keywords: Functional magnetic resonance imaging; Neural networks; Parkinson's disease; Resting-state.


Conflict of interest statement

The authors declare no conflict of interests.

Figures

Figure 1
Figure 1
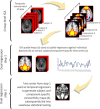
Seed‐based correlation techniques are straightforward and easily interpretable methods in functional connectivity analysis 96 that necessitate a priori hypotheses for seed definition. Briefly, the mean time courses of regions of interest (ROI)—representing structures or circuits of interest, or the main nodes of ICNs—are extracted. In seed‐to‐seed (or node‐to‐node) techniques, the mean time course of each ROI is correlated with the mean time courses of every other ROI, limiting the analysis to the circuits of interest. Alternatively, in seed‐to‐whole‐brain analyses, ROI time courses are used as regressors against the time courses of all voxels in the brain. Whole‐brain r‐correlation maps—in which the value assigned to each voxel is given by the correlation coefficient between its time series and the time series of the ROI in question—are thus generated, corresponding to the functional connectivity maps of each ROI. Subsequently, Fisher's r‐to‐z transformation is typically applied to ensure that the correlation coefficients are approximately normally distributed. The resulting connectivity maps are then analyzed using voxelwise statistical testing.
Figure 2
Figure 2
Independent component analysis (ICA) is a data‐driven procedure that identifies coherent spatial signal fluctuation patterns in the dataset, extracting maximally independent components associated with the underlying signal sources—such as ICN and spatially structured artifacts—while avoiding the potential biases in the a priori selection of ROIs 105, 107. The number of components estimated in ICA (i.e., its dimensionality reduction) is a possible source of variability in study results as there is no single best approach for characterizing the complex hierarchy of ICN neurobiology 104. Performing between‐subject ICA analysis is not a straightforward procedure, as it is difficult to establish a direct, one‐to‐one correspondence of ICNs identified with individual‐level ICAs 108. Most current resting‐state fMRI approaches involve performing group‐level ICA on the temporally concatenated datasets of all subjects—allowing the extraction of subject‐specific time courses and group‐common spatial maps 108. This is followed by the reconstruction of individual ICN maps through procedures such as dual regression or direct back‐reconstruction techniques 104, 108, 109, 110. These methods minimize the problem of intersubject ICN correspondence and takes advantage of the higher signal‐to‐noise ratio offered by analyzing several subjects conjointly 104.
Figure 3
Figure 3
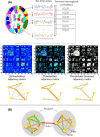
Panel A: Definition of functional brain networks. In its simplest form, the functional connectivity between a given pair of nodes is defined by the Pearson correlation between their respective time series. An adjacency matrix representing all internodal correlation coefficients is subsequently thresholded to discard weak, possibly noise‐related connections. There is no universally accepted approach for thresholding, however. The use of fixed strength thresholds can result in graphs with different connection density, making intersubject comparisons difficult 94. Fixed density thresholds, on the other hand, can be inappropriate in the presence of significant overall connectivity differences 94. The resulting graphs will be weighted if correlation strength is taken into account. Otherwise, binary graphs are generated. Panel B: Global and nodal network metrics. In the small network shown, the red line indicates the shortest path between nodes d and e. The characteristic path length of a node informs about how closely connected this node is to all other network nodes. It is given by the average shortest path length between itself and every other node, or, in its binary form, the average number of edges that need to be traversed in order to get from this to any other node 95. Network integration is given by the global characteristic path length (average of the characteristic path lengths of all nodes). The clustering coefficient of node a is represented by the number of triangles formed with its neighboring nodes (b, c, and d) 111. Only one triangle (green, a‐b‐c) is present out of three possible triangles (dashed lines, a‐b‐d and a‐c‐d), yielding a clustering coefficient of 1/3. The clustering coefficient describes how interconnected a node's neighbors are. The global clustering coefficient, given by the average of the clustering coefficients of all nodes in a network, is a measure of local connectedness or network segregation. A balance between global characteristic path length and clustering coefficients defines small‐world networks, characterized by high local specialization and some global shortcuts, allowing fast information transfer 111, 112. The human connectome displays small‐world topology in both functional and structural networks 112, 113. The degree of a node (number of input or output connections linked to it) describes this node's accessibility within the network 114. Degree in neural networks follows a heavy‐tailed distribution, indicating the existence of a set of highly connected or hub nodes 115. Hubs are hypothesized to be relevant for overall information transfer 116 and appear to be preferentially affected in several disorders 117. Finally, the measure of modularity indicates how well a network can be subdivided into well‐defined modules or communities made up of densely interconnected nodes with few intermodular connections, possibly representing the network's functional subcomponents. The small network shown contains two modules, connected by two connector hub nodes.

References

    1. Pont‐Sunyer C, Hotter A, Gaig C, et al. The Onset of Nonmotor Symptoms in Parkinson's disease (The ONSET PD Study). Mov Disord 2014;30:229–237. - PubMed
    1. Bressler SL, Menon V. Large‐scale brain networks in cognition: emerging methods and principles. Trends Cogn Sci 2010;14:277–290. - PubMed
    1. Pievani M, de Haan W, Wu T, et al. Functional network disruption in the degenerative dementias. Lancet Neurol 2011;10:829–843. - PMC - PubMed
    1. Fox MD, Snyder AZ, Vincent JL, et al. The human brain is intrinsically organized into dynamic, anticorrelated functional networks. Proc Natl Acad Sci U S A 2005;102:9673–9678. - PMC - PubMed
    1. Greicius MD, Krasnow B, Reiss AL, et al. Functional connectivity in the resting brain: a network analysis of the default mode hypothesis. Proc Natl Acad Sci U S A 2003;100:253–258. - PMC - PubMed

Publication types