. 2015 Sep 15;26(18):3165-77.
doi: 10.1091/mbc.E15-03-0147. Epub 2015 Jul 29.

Inflammation-induced desmoglein-2 ectodomain shedding compromises the mucosal barrier

Affiliations

Inflammation-induced desmoglein-2 ectodomain shedding compromises the mucosal barrier

Ryuta Kamekura et al. Mol Biol Cell. .

Abstract

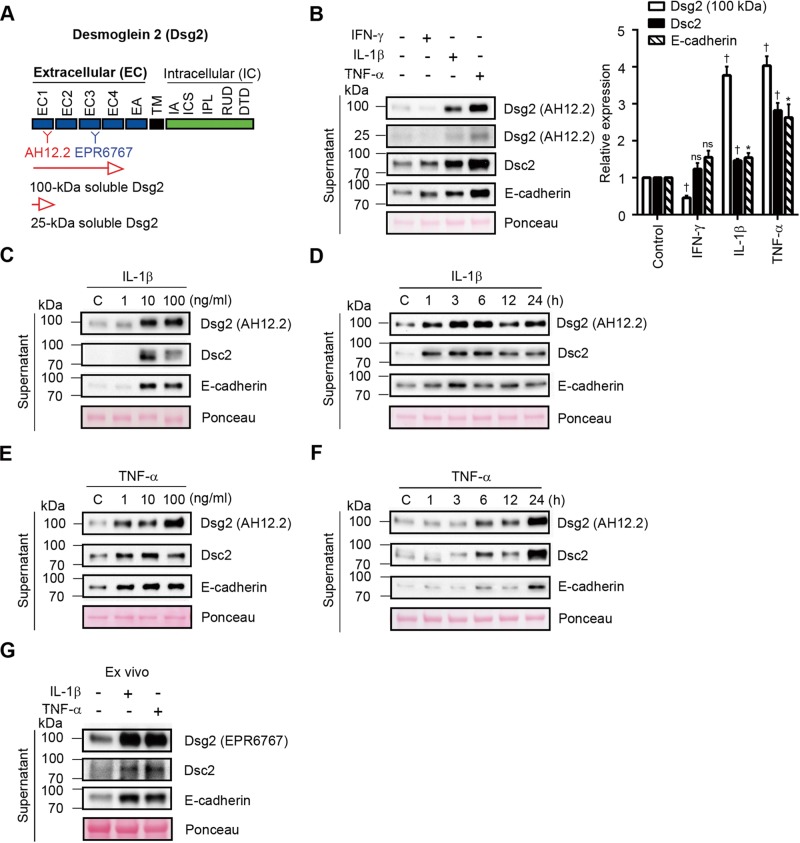
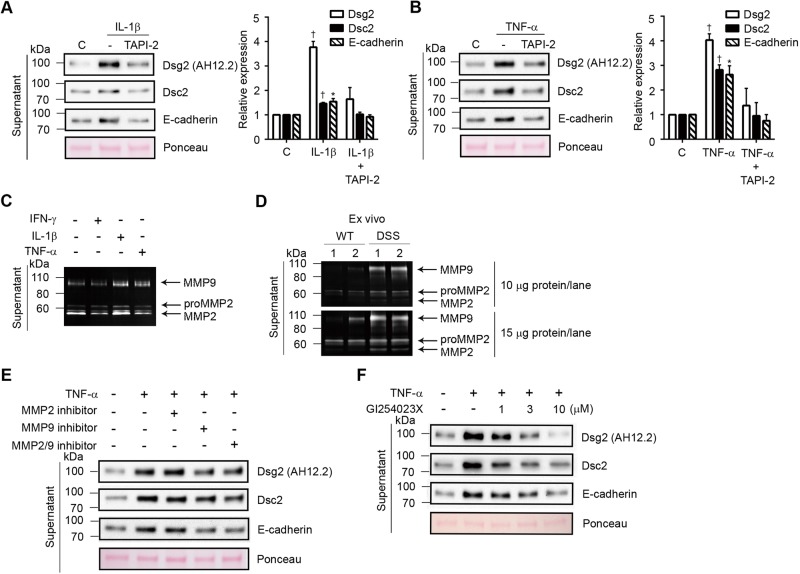
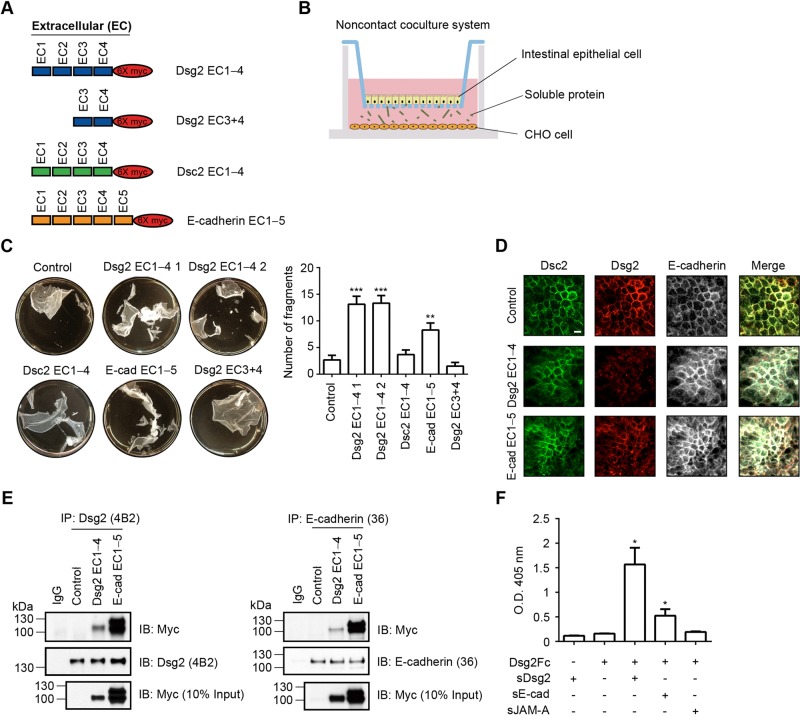
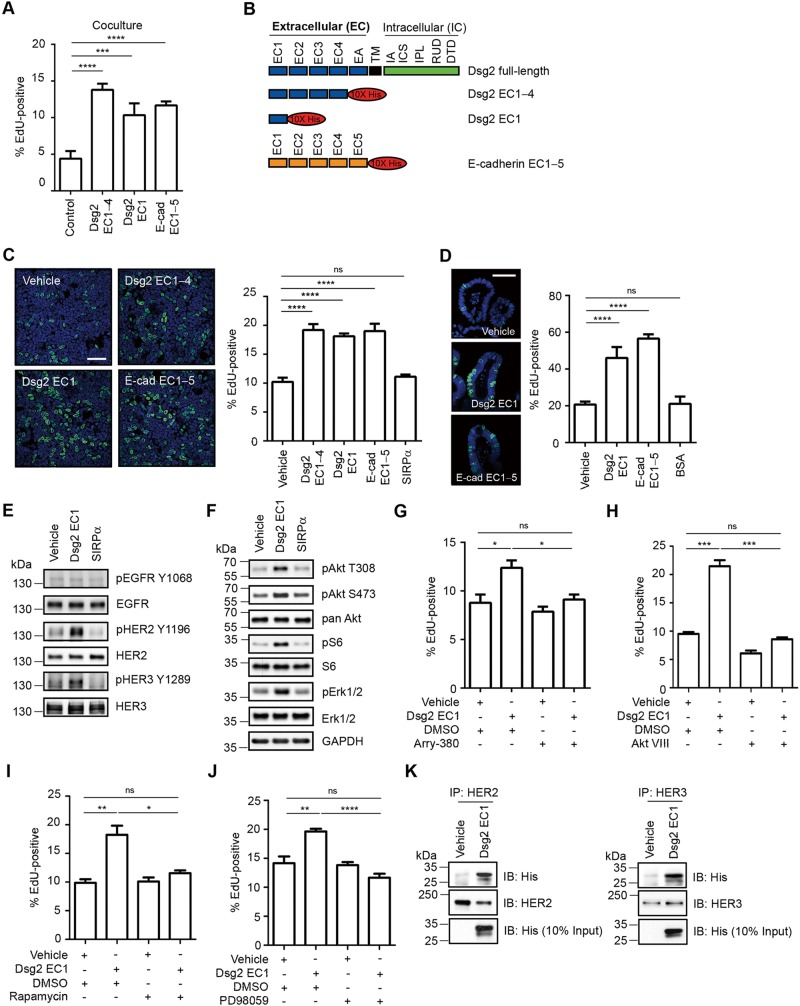
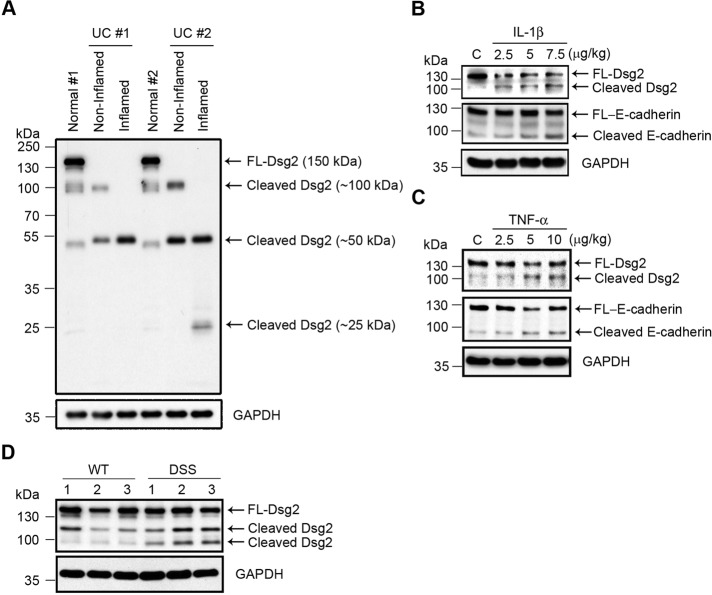
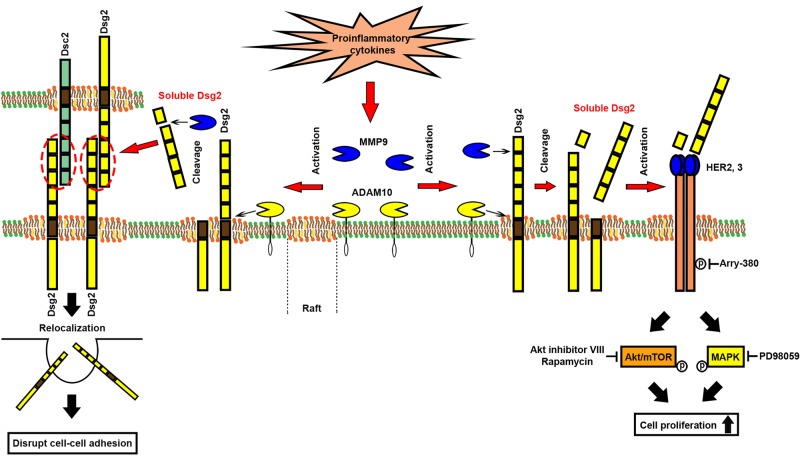
Desmosomal cadherins mediate intercellular adhesion and control epithelial homeostasis. Recent studies show that proteinases play an important role in the pathobiology of cancer by targeting epithelial intercellular junction proteins such as cadherins. Here we describe the proinflammatory cytokine-induced activation of matrix metalloproteinase 9 and a disintegrin and metalloproteinase domain-containing protein 10, which promote the shedding of desmosomal cadherin desmoglein-2 (Dsg2) ectodomains in intestinal epithelial cells. Epithelial exposure to Dsg2 ectodomains compromises intercellular adhesion by promoting the relocalization of endogenous Dsg2 and E-cadherin from the plasma membrane while also promoting proliferation by activation of human epidermal growth factor receptor 2/3 signaling. Cadherin ectodomains were detected in the inflamed intestinal mucosa of mice with colitis and patients with ulcerative colitis. Taken together, our findings reveal a novel response pathway in which inflammation-induced modification of columnar epithelial cell cadherins decreases intercellular adhesion while enhancing cellular proliferation, which may serve as a compensatory mechanism to promote repair.


Figures

FIGURE 1:
FIGURE 1:
Proinflammatory cytokines promote cleavage and shedding of cadherins in intestinal epithelial cells. (A) Schematic representation of protein domain of Dsg2 and epitope mapping of AH12.2 and EPR6767 monoclonal antibodies against Dsg2. EC, extracellular subdomain; EA, extracellular anchor; TM, transmembrane domain; IA, intracellular anchor; ICS, intracellular cadherin-typical sequence; IPL, intracellular proline-rich linker domain; RUD, repeated-unit domain; DTD, desmoglein-specific terminal domain. (B) Immunoblot analysis showing cleavage products of epithelial cadherins in culture supernatants from T84 cells treated with 100 U/ml IFN-γ, 20 ng/ml IL-1β, or 50 ng/ml TNF-α for 24 h. Histograms represent the relative expression of Dsg2 (100 kDa), Dsc2, and E-cadherin cleavage products, as determined by densitometry analysis. Results are expressed as means ± SEM of five independent experiments; *p < 0.05, p < 0.0001, ns, not significant, z test. (C, D) Immunoblot analysis showing soluble Dsg2 (sDsg2), Dsc2 (sDsc2), and E-cadherin (sE-cadherin) in culture supernatants from T84 cells treated with 1, 10, or 100 ng/ml IL-1β for 6 h (C) or 20 ng/ml IL-1β for up to 24 h (D). (E, F) Immunoblot analysis showing sDsg2, sDsc2, and sE-cadherin in culture supernatants from T84 cells treated with 1, 10, or 100 ng/ml TNF-α for 24 h (E) or 50 ng/ml TNF-α for up to 24 h (F). (G) Immunoblot analysis showing sDsg2, sDsc2, and sE-cadherin in culture supernatants from ex vivo mouse colonic mucosal cultures treated with 20 ng/ml IL-1β or 50 ng/ml TNF-α for 6 h. (B–G) Ponceau staining was used as a loading control. C, control (C–F).
FIGURE 2:
FIGURE 2:
MMP9 and ADAM10 cleave cadherin ectodomains in intestinal epithelial cells. (A, B) Immunoblot analysis of soluble Dsg2, Dsc2, and E-cadherin in culture supernatants from T84 cells treated with 20 ng/ml IL-1β for 6 h (A) or 50 ng/ml TNF-α for 24 h (B) in the presence or absence of 20 μM TAPI-2. Histograms represent the relative expression of Dsg2 (100 kDa), Dsc2, and E-cadherin cleavage products, as determined by densitometric analysis. Results are expressed as means ± SEM of five independent experiments; *p < 0.05, p < 0.0001, z test. (C) Zymographic analysis of MMP2 and 9 activities in culture supernatants from T84 cells treated with 100 U/ml IFN-γ, 20 ng/ml IL-1β, or 50 ng/ml TNF-α for 24 h. (D) Zymographic analysis of MMP2 and 9 activities in the supernatant of ex vivo mouse colonic mucosa cultures derived from wild-type control mice (WT) and mice with DSS-induced colitis (DSS). The colonic mucosa from control and colitic mice was incubated with culture medium for 6 h. The top and bottom images were obtained from gels loaded with a small amount (10 μg/lane) and a large amount (15 μg/lane) of protein in the gels, respectively. (E) Immunoblot analysis of sDsg2, sDsc2, and sE-cadherin in culture supernatants from T84 cells treated with 50 ng/ml TNF-α in the presence or absence of 5 μM MMP2 inhibitor, 100 μM MMP9 inhibitor, or 2.5 μM MMP2/9 inhibitor for 24 h. (F) Immunoblot analysis showing sDsg2, sDsc2, and sE-cadherin in culture supernatants from T84 cells treated with 50 ng/ml TNF-α in the presence or absence of GI254023X (1, 3, or 10 μM) for 24 h. (A, B, E, F) Ponceau staining was used as a loading control. C, control (A, B).
FIGURE 3:
FIGURE 3:
Soluble Dsg2 decreases intercellular adhesion of intestinal epithelial cells. (A) Schematic representation of the Dsg2, Dsc2, and E-cadherin ectodomain constructs used in this study. (B) Schematic overview of the noncontact coculture system used in this study. (C) Results of the dispase assay showing the strength of intercellular adhesion in T84 cells cocultured with CHO cells secreting sDsg2, sDsc2, or sE-cadherin for 48 h. Epithelial fragments were quantified as a measure of cell–cell adhesion. Results are expressed as means ± SEM of three independent experiments; **p < 0.01, ***p < 0.001 vs. control, t test. (D) Immunofluorescence confocal microscopy (Z-stacks) results show the localization of endogenous Dsc2, Dsg2, and E-cadherin in T84 cells cocultured with CHO cells secreting sDsg2 or sE-cadherin for 48 h. Dsc2, green; Dsg2, red; E-cadherin, white. Scale bar, 10 μm. (E) Coimmunoprecipitation results show the interaction between sDsg2 EC1–4 or sE-cadherin EC1–5 and endogenous Dsg2 or E-cadherin in T84 cells cocultured with CHO cells secreting sDsg2 or sE-cadherin for 24 h. IP, immunoprecipitation; IB, immunoblot. (F) ELISA results showing the binding of sDsg2, sE-cadherin, or soluble JAM-A (sJAM-A, negative control) to immobilized Dsg2Fc. Results are expressed as means ± SEM of three independent experiments; *p < 0.05 vs. sDsg2 or Dsg2Fc only, t test.
FIGURE 4:
FIGURE 4:
Dsg2 extracellular fragments regulate HER2/3-Akt, mTOR, and MAPK signaling pathways and regulate epithelial cell proliferation. (A) T84 cells were cocultured with CHO cells secreting sDsg2 or sE-cadherin, and cell proliferation was evaluated by measuring EdU incorporation into newly synthesized DNA. Images were obtained by confocal microscopy, and EdU-positive nuclei were counted. ***p < 0.001, ****p < 0.0001 vs. control, t test. (B) Schematic representation of Dsg2 and E-cadherin ectodomain constructs used in this study. EC, extracellular subdomain; EA, extracellular anchor; TM, transmembrane domain; IA, intracellular anchor; ICS, intracellular cadherin-typical sequence; IPL, intracellular proline-rich linker domain; RUD, repeated-unit domain; DTD, desmoglein-specific terminal domain. (C) Proliferation of T84 cells treated with sDsg2 (EC1–4 or EC1), sE-cadherin (EC1–5), or SIRPα (negative control) was determined by EdU incorporation. ****p < 0.0001 vs. vehicle control; ns, not significant; t test. Scale bar, 50 μm. (D) Proliferation of enteroids treated with sDsg2, sE-cadherin, or bovine serum albumin (BSA, negative control) was determined by EdU incorporation. ****p < 0.0001 vs. vehicle control; ns, not significant; t test. Scale bar, 50 μm. (E) Immunoblot analysis of pEGFR (Y1068), EGFR, pHER2 (Y1196), HER2, pHER3 (Y1289), and HER3 in T84 cells exposed to Dsg2 EC1 or SIRPα (negative control) for 1 h. (F) Immunoblot analysis of EGFR-HER signaling in T84 cells treated with Dsg2 EC1 or SIRPα (negative control) for 1 h. Cell lysates were analyzed by immunoblotting against pAkt (T308, S473), pan Akt, pS6 (S235/S236), S6, pErk1/2 (T202/Y204), and Erk1/2. GAPDH was used as a loading control. (G–J) EdU incorporation showing proliferation of T84 cells treated with Dsg2 EC1 and 100 nM Arry-380 (HER2 inhibitor), 2.12 μM Akt inhibitor VIII, 2 nM rapamycin (mTORC1 inhibitor), or 20 μM PD98059 (MEK inhibitor). *p < 0.05, **p < 0.01, ***p < 0.001, ****p < 0.0001; ns, not significant; t test. (K) Results of coimmunoprecipitation demonstrating interactions between Dsg2 EC1 and HER2 or HER3 in T84 cells. IP, immunoprecipitation; IB, immunoblotting. (C, D) EdU, green; TO-PRO-3 iodide (nuclei), blue. (A, C, D, G–J) Histograms represent the percentage of nuclei that were EdU-positive. Results are expressed as means ± SEM of at least 10 different fields.
FIGURE 5:
FIGURE 5:
Increased levels of Dsg2 extracellular fragments in inflamed intestinal mucosa. (A) Immunoblot analysis of Dsg2 (AH12.2) in noninflamed and inflamed human colonic tissues from patients with ulcerative colitis (UC) and healthy controls (Normal). (B, C) Immunoblot analysis of Dsg2 (EPR6767) and E-cadherin (DECMA-1) in the colonic mucosa of mice that received intraperitoneal injections of IL-1β (B) or TNF-α (C). (D) Immunoblot analysis of Dsg2 protein in the colonic mucosa of mice with DSS-induced colitis (DSS) and wild-type controls (WT). The samples were analyzed using antibodies against Dsg2 clone ERP6767. (A–D) GAPDH was used as a loading control. FL, full-length. C, control (B, C).
FIGURE 6:
FIGURE 6:
Model showing the role of soluble Dsg2 in intestinal epithelial homeostasis. The mechanism by which soluble Dsg2 (sDsg2) mediates intestinal epithelial homeostasis. During inflammation, proinflammatory cytokines IL-1β and TNF-α in the milieu of the epithelium stimulate the activation of proteinases (MMPs and ADAMs) involved in the cleavage of Dsg2 (Figures 1 and 2 and Supplemental Figure S1). sDsg2 interacts with membrane-bound Dsg2 and E-cadherin and induces their relocalization from the plasma membrane, thereby decreasing intercellular adhesion between intestinal epithelial cells (Figure 3). sDsg2 also interacts with HER2 or HER3, activating the Akt/mTOR and MAPK signaling pathways to promote IEC proliferation (Figure 4 and Supplemental Figure S4).

Similar articles

Cited by

References

    1. Allen E, Yu QC, Fuchs E. Mice expressing a mutant desmosomal cadherin exhibit abnormalities in desmosomes, proliferation, and epidermal differentiation. J Cell Biol. 1996;133:1367–1382. - PMC - PubMed
    1. Amagai M, Yamaguchi T, Hanakawa Y, Nishifuji K, Sugai M, Stanley JR. Staphylococcal exfoliative toxin B specifically cleaves desmoglein 1. J Invest Dermatol. 2002;118:845–850. - PubMed
    1. Baselga J, Swain SM. Novel anticancer targets: revisiting ERBB2 and discovering ERBB3. Nat Rev Cancer. 2009;9:463–475. - PubMed
    1. Baugh MD, Perry MJ, Hollander AP, Davies DR, Cross SS, Lobo AJ, Taylor CJ, Evans GS. Matrix metalloproteinase levels are elevated in inflammatory bowel disease. Gastroenterology. 1999;117:814–822. - PubMed
    1. Bech-Serra JJ, Santiago-Josefat B, Esselens C, Saftig P, Baselga J, Arribas J, Canals F. Proteomic identification of desmoglein 2 and activated leukocyte cell adhesion molecule as substrates of ADAM17 and ADAM10 by difference gel electrophoresis. Mol Cell Biol. 2006;26:5086–5095. - PMC - PubMed

Publication types