. 2015 Jul 30:5:12524.
doi: 10.1038/srep12524.

Transcriptional profiling of macrophages derived from monocytes and iPS cells identifies a conserved response to LPS and novel alternative transcription

Affiliations

Transcriptional profiling of macrophages derived from monocytes and iPS cells identifies a conserved response to LPS and novel alternative transcription

Kaur Alasoo et al. Sci Rep. .

Abstract

Macrophages differentiated from human induced pluripotent stem cells (IPSDMs) are a potentially valuable new tool for linking genotype to phenotype in functional studies. However, at a genome-wide level these cells have remained largely uncharacterised. Here, we compared the transcriptomes of naïve and lipopolysaccharide (LPS) stimulated monocyte-derived macrophages (MDMs) and IPSDMs using RNA-Seq. The IPSDM and MDM transcriptomes were broadly similar and exhibited a highly conserved response to LPS. However, there were also significant differences in the expression of genes associated with antigen presentation and tissue remodelling. Furthermore, genes coding for multiple chemokines involved in neutrophil recruitment were more highly expressed in IPSDMs upon LPS stimulation. Additionally, analysing individual transcript expression identified hundreds of genes undergoing alternative promoter and 3' untranslated region usage following LPS treatment representing a previously under-appreciated level of regulation in the LPS response.


Figures

Figure 1
Figure 1. Gene expression variation between iPS cells, IPSDMs and MDMs.
Principal Component Analysis of expressed genes (TPM >2) in iPS cells, IPSDMs and MDMs.
Figure 2
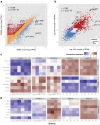
Figure 2. Differential expression analysis of IPSDMs vs MDMs.
(a) Scatter plot of gene expression levels between MDMs and IPSDMs. Genes that are significantly more highly expressed in IPSDMs are shown in red and genes that are significantly more highly expressed in MDMs are shown in blue. (b) Scatter plot of fold change in response to LPS between MDMs (x-axis) and IPSDMs (y-axis). Only genes with significant LPS or interaction term in the linear model are shown. Genes where LPS response is in opposite directions between MDMs and IPSDMs are highlighted in purple. Raw data is presented in Supplementary Table S3. (c) Heat map of genes differentially expressed between MDMs and IPSDMs. Representative genes from significantly overrepresented Gene Ontology groups (Table 1) include antigen presentation (HLA genes), lysosome formation (LYZ), angiogenesis (VEGFC, TGFB2), and extracellular matrix (SERPINE2, MMP2 COL4A5). The same genes are also marked in panel a. (d) Heatmap of example genes upregulated in LPS response.
Figure 3
Figure 3. Chemokine genes that were particularly upregulated in either IPSDMs or MDMs in LPS response.
Their annotated receptors and target cell types were taken from the literature. Mean absolute expression values are shown in Supplementary Table S4.
Figure 4
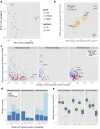
Figure 4. Alternative transcription in IPSDMs and MDMs.
(a) Principal component analysis of relative transcript proportions in IPS cells, IPSDMs and MDMs. Only genes with mean TPM >2 in all conditions were included. (b) Alternative transcription events detected in LPS response. Each point corresponds to an alternative transcription event and shows the absolute change in the proportion of the most highly expressed transcript (across all samples) in LPS response in MDMs (x-axis) and IPSDMs (y-axis). (c) All detected alternative transcription events were divided into three groups based on whether they affected alternative promoter, alternative splicing or alternative 3′ end of the transcript. For each event, we plotted its change in proportion in LPS response (x-axis) against its change between macrophage types (y-axis). The events are coloured by the most parsimonious model of change selected by mmseq: LPS effect (difference between naïve and LPS-stimulated cells only); macrophage (MF) type (difference between IPSDMs and MDMs only); both (data support both MF type and LPS effects). (d) Number of alternative transcription events form panel c grouped by position in the gene (alternative promoter, alternative splicing, alternative 3′ end) and most parsimonious model selected by mmseq. (e) Relative expression of long alternative 3′ UTRs in genes showing a change between IPSDM and MDMs (MF type), between naïve and LPS-stimulated cells (LPS effect) and for genes showing both types of change.
Figure 5
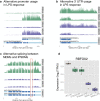
Figure 5. Examples of alternative transcript usage.
Each plot shows normalised read depth across the gene body in IPSDMs (green) and MDMs (purple) with gene structure in the panel beneath each plot. Introns have been compressed relative to exons to facilitate visualisation. (a) Example of alternative promoter usage in LPS response. (b) Examples of 3′ UTR shortening in LPS response. (c) Example of alternative splicing between MDMs and IPSDMs. The alternatively spliced exon is marked with the red rectangle. (d) Expression of RBFOX2 gene in iPS cells, IPSDMs and MDMs.

References

    1. Wynn T. A., Chawla A. & Pollard J. W. Macrophage biology in development, homeostasis and disease. Nature 496, 445–455 (2013). - PMC - PubMed
    1. Murray P. J. & Wynn T. A. Protective and pathogenic functions of macrophage subsets. Nat. Rev. Immunol. 11, 723–737 (2011). - PMC - PubMed
    1. Adati N., Huang M.-C., Suzuki T., Suzuki H. & Kojima T. High-resolution analysis of aberrant regions in autosomal chromosomes in human leukemia THP-1 cell line. BMC Res. Notes 2, 153 (2009). - PMC - PubMed
    1. Schildberger A., Rossmanith E., Eichhorn T., Strassl K. & Weber V. Monocytes, peripheral blood mononuclear cells, and THP-1 cells exhibit different cytokine expression patterns following stimulation with lipopolysaccharide. Mediators Inflamm. 2013, 697972 (2013). - PMC - PubMed
    1. Schroder K. et al.. Conservation and divergence in Toll-like receptor 4-regulated gene expression in primary human versus mouse macrophages. Proc. Natl. Acad. Sci. USA. 109, E944–53 (2012). - PMC - PubMed

Publication types

MeSH terms