

Sleep deficits but no metabolic deficits in premanifest Huntington's disease
- PMID: 26224419
- PMCID: PMC4832311
- DOI: 10.1002/ana.24495
Sleep deficits but no metabolic deficits in premanifest Huntington's disease
Abstract
Objective: Huntington disease (HD) is a fatal autosomal dominant, neurodegenerative condition characterized by progressively worsening motor and nonmotor problems including cognitive and neuropsychiatric disturbances, along with sleep abnormalities and weight loss. However, it is not known whether sleep disturbances and metabolic abnormalities underlying the weight loss are present at a premanifest stage.
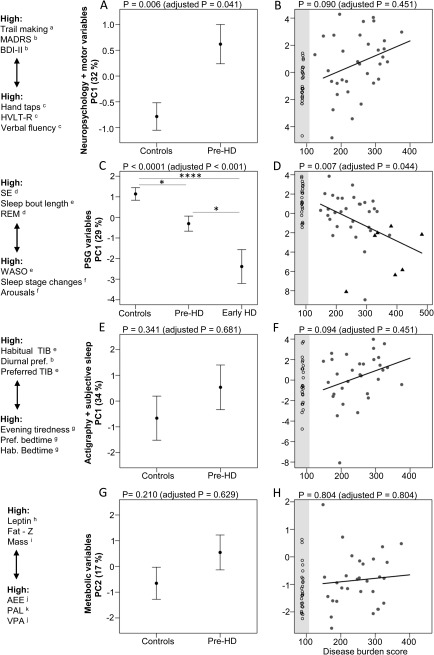
Methods: We performed a comprehensive sleep and metabolic study in 38 premanifest gene carrier individuals and 36 age- and sex-matched controls. The study consisted of 2 weeks of actigraphy at home, 2 nights of polysomnography and multiple sleep latency tests in the laboratory, and body composition assessment using dual energy x-ray absorptiometry scanning with energy expenditure measured over 10 days at home by doubly labeled water and for 36 hours in the laboratory by indirect calorimetry along with detailed cognitive and clinical assessments. We performed a principal component analyses across all measures within each studied domain.
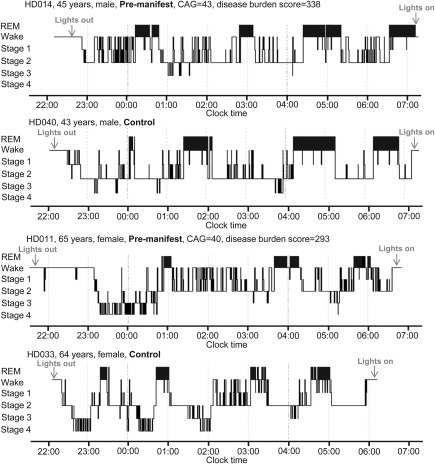
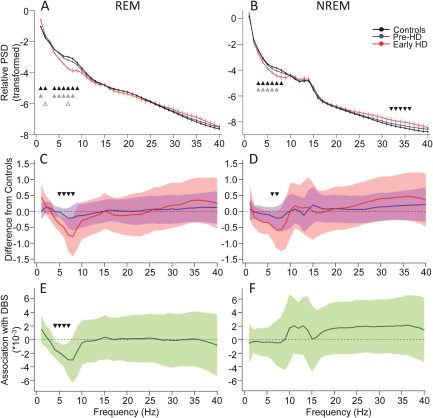
Results: Compared to controls, premanifest gene carriers had more disrupted sleep, which was best characterized by a fragmented sleep profile. These abnormalities, as well as a theta power (4-7Hz) decrease in rapid eye movement sleep, were associated with disease burden score. Objectively measured sleep problems coincided with the development of cognitive, affective, and subtle motor deficits and were not associated with any metabolic alterations.
Interpretation: The results show that among the earliest abnormalities in premanifest HD is sleep disturbances. This raises questions as to where the pathology in HD begins and also whether it could drive some of the early features and even possibly the pathology.
© 2015 The Authors Annals of Neurology published by Wiley Periodicals, Inc. on behalf of American Neurological Association.
Figures
Similar articles
-
Sleep abnormalities are associated with greater cognitive deficits and disease activity in Huntington's disease: a 12-year polysomnographic study.Brain Commun. 2025 Apr 2;7(2):fcaf126. doi: 10.1093/braincomms/fcaf126. eCollection 2025. Brain Commun. 2025. PMID: 40226381 Free PMC article.
-
Longitudinal analysis of the electroencephalogram and sleep phenotype in the R6/2 mouse model of Huntington's disease.Brain. 2013 Jul;136(Pt 7):2159-72. doi: 10.1093/brain/awt132. Brain. 2013. PMID: 23801738
-
Clinical Determinants of Dual Tasking in People With Premanifest Huntington Disease.Phys Ther. 2021 Apr 4;101(4):pzab016. doi: 10.1093/ptj/pzab016. Phys Ther. 2021. PMID: 33482001
-
Sleep in Huntington's disease: a systematic review and meta-analysis of polysomongraphic findings.Sleep. 2019 Oct 9;42(10):zsz154. doi: 10.1093/sleep/zsz154. Sleep. 2019. PMID: 31328779 Free PMC article.
-
Hypothalamic dysfunction and neuroendocrine and metabolic alterations in Huntington's disease: clinical consequences and therapeutic implications.Rev Neurosci. 2007;18(3-4):223-51. doi: 10.1515/revneuro.2007.18.3-4.223. Rev Neurosci. 2007. PMID: 18019608 Review.
Cited by
-
Scheduled feeding improves sleep in a mouse model of Huntington's disease.bioRxiv [Preprint]. 2024 May 7:2024.05.04.592428. doi: 10.1101/2024.05.04.592428. bioRxiv. 2024. Update in: Front Neurosci. 2024 Aug 05;18:1427125. doi: 10.3389/fnins.2024.1427125. PMID: 38766112 Free PMC article. Updated. Preprint.
-
Circadian and Sleep Dysfunctions in Neurodegenerative Disorders-An Update.Front Neurosci. 2021 Jan 18;14:627330. doi: 10.3389/fnins.2020.627330. eCollection 2020. Front Neurosci. 2021. PMID: 33536872 Free PMC article. Review.
-
Neurophysiological hallmarks of Huntington's disease progression: an EEG and fMRI connectivity study.Front Aging Neurosci. 2023 Dec 15;15:1270226. doi: 10.3389/fnagi.2023.1270226. eCollection 2023. Front Aging Neurosci. 2023. PMID: 38161585 Free PMC article.
-
Systems Genetic Analyses Highlight a TGFβ-FOXO3 Dependent Striatal Astrocyte Network Conserved across Species and Associated with Stress, Sleep, and Huntington's Disease.PLoS Genet. 2016 Jul 8;12(7):e1006137. doi: 10.1371/journal.pgen.1006137. eCollection 2016 Jul. PLoS Genet. 2016. PMID: 27390852 Free PMC article.
-
Mechanisms linking circadian clocks, sleep, and neurodegeneration.Science. 2016 Nov 25;354(6315):1004-1008. doi: 10.1126/science.aah4968. Science. 2016. PMID: 27885006 Free PMC article. Review.
References
-
- Morrison PJ. Accurate prevalence and uptake of testing for Huntington's disease. Lancet Neurol 2010;9:1147. - PubMed
-
- Harper PS. The epidemiology of Huntington's disease. Hum Genet 1992;89:365–376. - PubMed
-
- Snell RG, MacMillan JC, Cheadle JP, et al. Relationship between trinucleotide repeat expansion and phenotypic variation in Huntington's disease. Nat Genet 1993;4:393–397. - PubMed
-
- Huntington's Disease Collaborative Research Group . A novel gene containing a trinucleotide repeat that is expanded and unstable on Huntington's disease chromosomes. Cell 1993;72:971–983. - PubMed
Publication types
MeSH terms
Grants and funding
LinkOut - more resources
Full Text Sources
Other Literature Sources
Medical
