

Characteristics of Vibration that Alter Cardiovascular Parameters in Mice
- PMID: 26224436
- PMCID: PMC4521570
Characteristics of Vibration that Alter Cardiovascular Parameters in Mice
Abstract
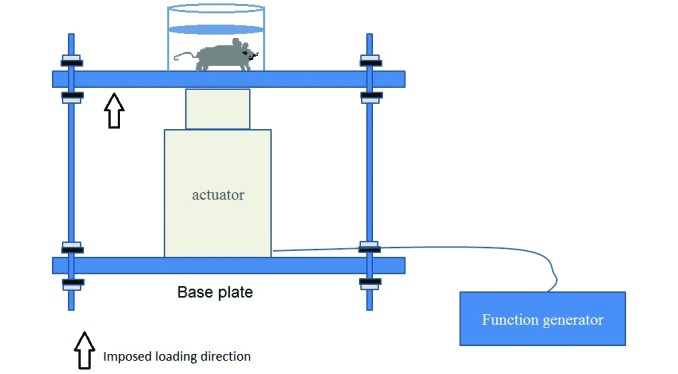
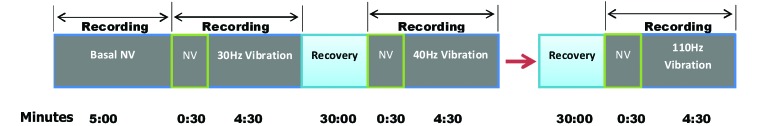
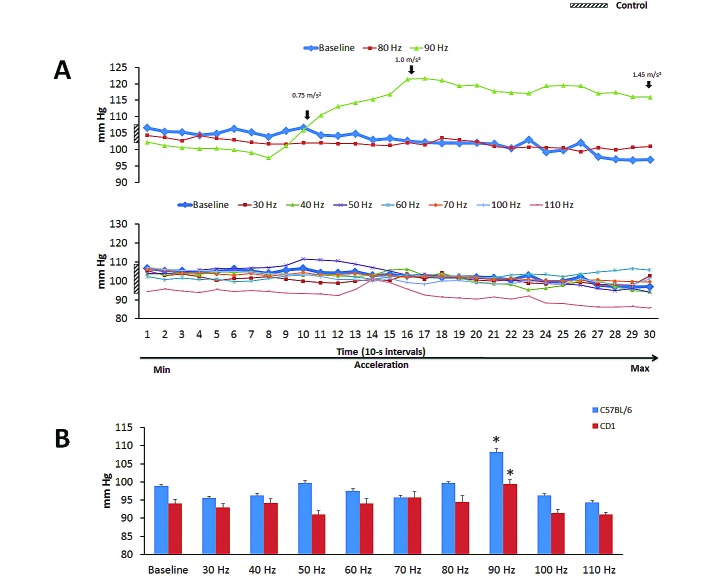
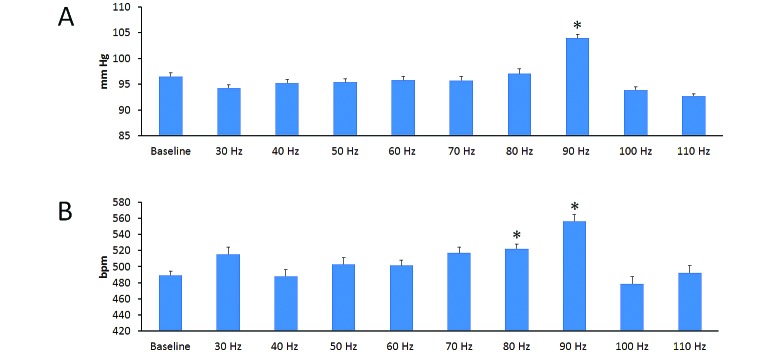
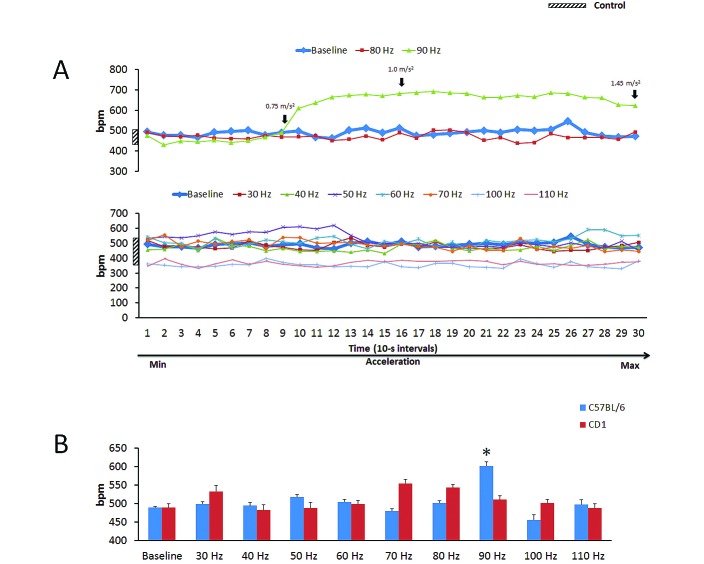
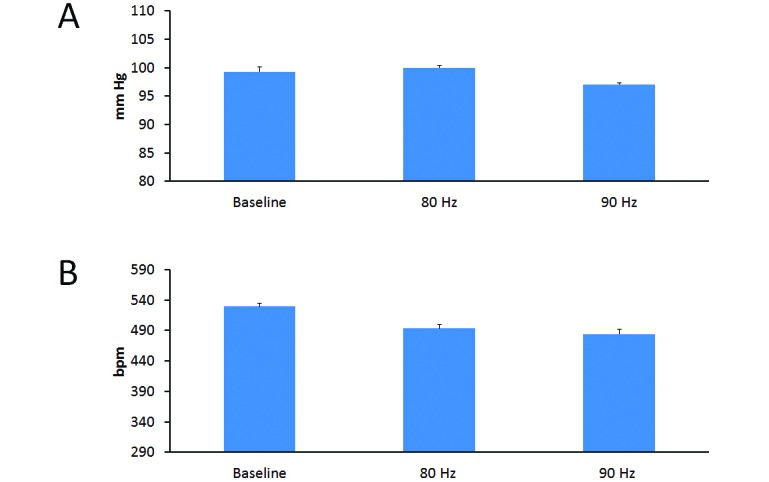
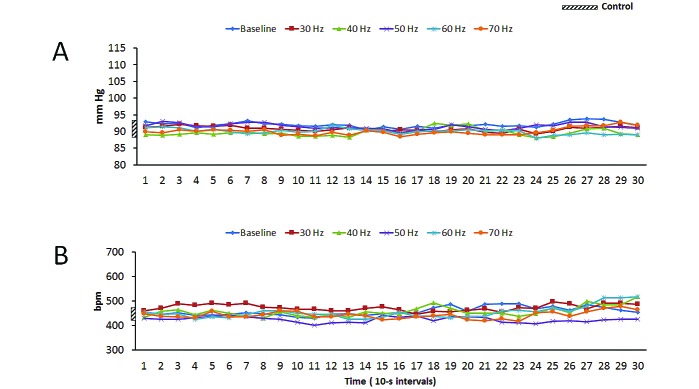
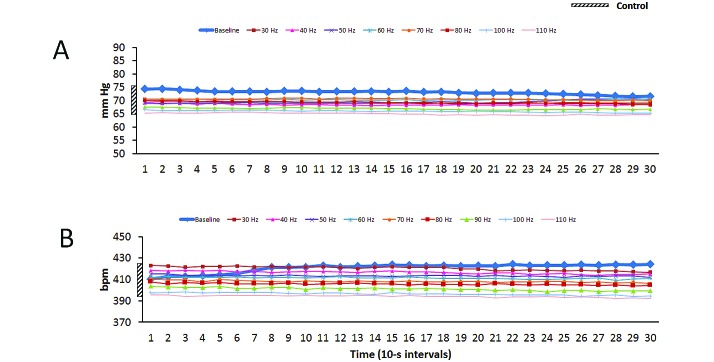
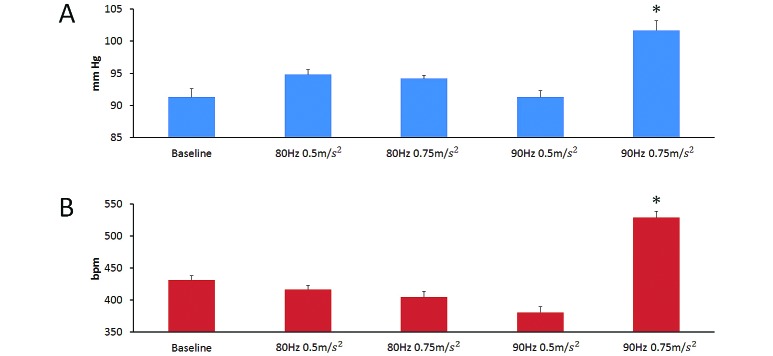
We hypothesized that short-term exposure of mice to vibration within a frequency range thought to be near the resonant frequency range of mouse tissue and at an acceleration of 0 to 1 m/s(2) would alter heart rate (HR) and mean arterial pressure (MAP). We used radiotelemetry to evaluate the cardiovascular response to vibration in C57BL/6 and CD1 male mice exposed to vertical vibration of various frequencies and accelerations. MAP was consistently increased above baseline values at an acceleration near 1 m/s(2) and a frequency of 90 Hz in both strains, and HR was increased also in C57BL/6 mice. In addition, MAP increased at 80 Hz in individual mice of both strains. When both strains were analyzed together, mean MAP and HR were increased at 90 Hz at 1 m/s(2), and HR was increased at 80 Hz at 1 m/s(2). No consistent change in MAP or HR occurred when mice were exposed to frequencies below 80 Hz or above 90 Hz. The increase in MAP and HR occurred only when the mice had conscious awareness of the vibration, given that these changes did not occur when anesthetized mice were exposed to vibration. Tested vibration acceleration levels lower than 0.75 m/s(2) did not increase MAP or HR at 80 or 90 Hz, suggesting that a relatively high level of vibration is necessary to increase these parameters. These data are important to establish the harmful frequencies and accelerations of environmental vibration that should be minimized or avoided in mouse facilities.
Figures
Similar articles
-
Vibration in mice: A review of comparative effects and use in translational research.Animal Model Exp Med. 2018 Jul 28;1(2):116-124. doi: 10.1002/ame2.12024. eCollection 2018 Jun. Animal Model Exp Med. 2018. PMID: 30891556 Free PMC article. Review.
-
Vibrating Frequency Thresholds in Mice and Rats: Implications for the Effects of Vibrations on Animal Health.Ann Biomed Eng. 2015 Aug;43(8):1957-64. doi: 10.1007/s10439-014-1226-y. Epub 2014 Dec 23. Ann Biomed Eng. 2015. PMID: 25533769
-
Vibration-induced Behavioral Responses and Response Threshold in Female C57BL/6 Mice.J Am Assoc Lab Anim Sci. 2018 Sep 1;57(5):447-455. doi: 10.30802/AALAS-JAALAS-17-00092. Epub 2018 Jul 30. J Am Assoc Lab Anim Sci. 2018. PMID: 30060780 Free PMC article.
-
Cardiovascular responses to some stressors in conscious rats.Kurume Med J. 1990;37 Suppl:S117-22. doi: 10.2739/kurumemedj.37.supplement_s117. Kurume Med J. 1990. PMID: 2381143
-
Evaluation of Vibration as an Extrinsic Variable in In Vivo Research.J Am Assoc Lab Anim Sci. 2024 Mar 1;63(2):107-115. doi: 10.30802/AALAS-JAALAS-23-000050. Epub 2024 Jan 5. J Am Assoc Lab Anim Sci. 2024. PMID: 38182133 Free PMC article. Review.
Cited by
-
Noise and Vibration in the Vivarium: Recommendations for Developing a Measurement Plan.J Am Assoc Lab Anim Sci. 2020 Nov 1;59(6):665-672. doi: 10.30802/AALAS-JAALAS-19-000131. Epub 2020 Sep 14. J Am Assoc Lab Anim Sci. 2020. PMID: 32928338 Free PMC article.
-
Vibration in mice: A review of comparative effects and use in translational research.Animal Model Exp Med. 2018 Jul 28;1(2):116-124. doi: 10.1002/ame2.12024. eCollection 2018 Jun. Animal Model Exp Med. 2018. PMID: 30891556 Free PMC article. Review.
-
Possible challenges in behavioral phenotyping of rodents following COVID-19 lockdown.Lab Anim (NY). 2020 Jun;49(6):159. doi: 10.1038/s41684-020-0559-4. Lab Anim (NY). 2020. PMID: 32398800 No abstract available.
-
Evaluation of Ambient Sound, Vibration, and Light in Rodent Housing Rooms.J Am Assoc Lab Anim Sci. 2022 Nov 1;61(6):660-671. doi: 10.30802/AALAS-JAALAS-22-000040. Epub 2022 Nov 15. J Am Assoc Lab Anim Sci. 2022. PMID: 36379474 Free PMC article.
-
Diversity of Effects of Mechanical Influences on Living Systems and Aqueous Solutions.Int J Mol Sci. 2025 Jun 10;26(12):5556. doi: 10.3390/ijms26125556. Int J Mol Sci. 2025. PMID: 40565019 Free PMC article. Review.
References
-
- Baig HA, Guarino BB, Lipschutz D, Winkelstein BA. 2013. Whole body vibration induces forepaw and hind paw behavioral sensitivity in the rat. J Orthop Res 31:1739–1744. - PubMed
-
- Bernatova I, Key MP, Lucot JB, Morris M. 2002. Circadian differences in stress-induced pressor reactivity in mice. Hypertension 40:768–773. - PubMed
-
- Bovenzi M. 1998. Exposure–response relationship in the hand–arm vibration syndrome: an overview of current epidemiology research. Int Arch Occup Environ Health 71:509–519. - PubMed
-
- Bovenzi M. 2006. Health risks from occupational exposures to mechanical vibration. Med Lav 97:535–541. - PubMed
Publication types
MeSH terms
LinkOut - more resources
Full Text Sources
Other Literature Sources