

Structural Variability within Frontoparietal Networks and Individual Differences in Attentional Functions: An Approach Using the Theory of Visual Attention
- PMID: 26224851
- PMCID: PMC4518045
- DOI: 10.1523/JNEUROSCI.0210-15.2015
Structural Variability within Frontoparietal Networks and Individual Differences in Attentional Functions: An Approach Using the Theory of Visual Attention
Abstract
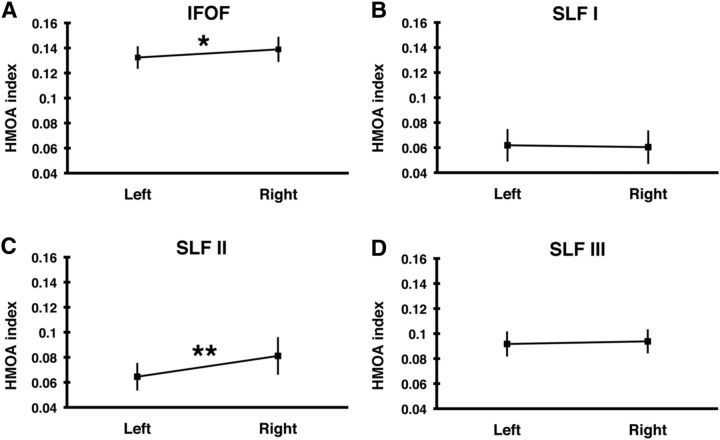
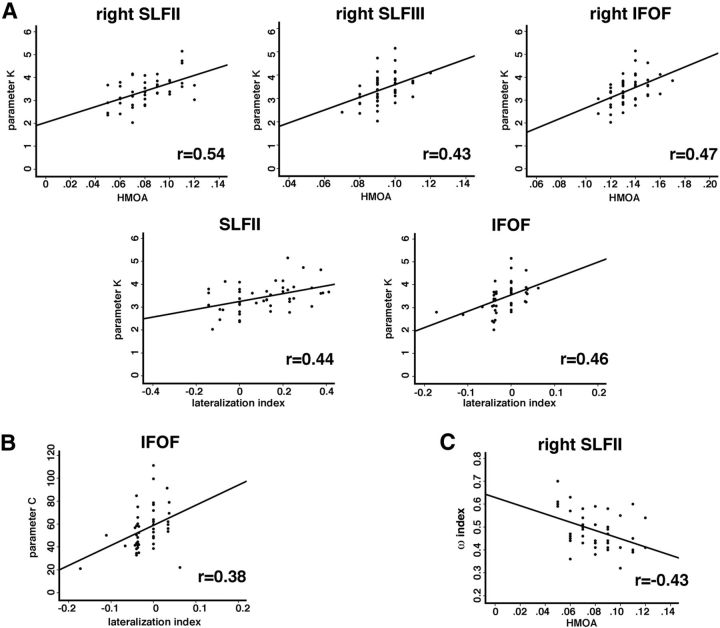
Visuospatial attention allows us to select and act upon a subset of behaviorally relevant visual stimuli while ignoring distraction. Bundesen's theory of visual attention (TVA) (Bundesen, 1990) offers a quantitative analysis of the different facets of attention within a unitary model and provides a powerful analytic framework for understanding individual differences in attentional functions. Visuospatial attention is contingent upon large networks, distributed across both hemispheres, consisting of several cortical areas interconnected by long-association frontoparietal pathways, including three branches of the superior longitudinal fasciculus (SLF I-III) and the inferior fronto-occipital fasciculus (IFOF). Here we examine whether structural variability within human frontoparietal networks mediates differences in attention abilities as assessed by the TVA. Structural measures were based on spherical deconvolution and tractography-derived indices of tract volume and hindrance-modulated orientational anisotropy (HMOA). Individual differences in visual short-term memory (VSTM) were linked to variability in the microstructure (HMOA) of SLF II, SLF III, and IFOF within the right hemisphere. Moreover, VSTM and speed of information processing were linked to hemispheric lateralization within the IFOF. Differences in spatial bias were mediated by both variability in microstructure and volume of the right SLF II. Our data indicate that the microstructural and macrostrucutral organization of white matter pathways differentially contributes to both the anatomical lateralization of frontoparietal attentional networks and to individual differences in attentional functions. We conclude that individual differences in VSTM capacity, processing speed, and spatial bias, as assessed by TVA, link to variability in structural organization within frontoparietal pathways.
Keywords: diffusion tractography; frontoparietal attention networks; individual differences; theory of visual attention; visual attention; visuospatial memory.
Copyright © 2015 Chechlacz et al.
Figures
Similar articles
-
A matter of hand: Causal links between hand dominance, structural organization of fronto-parietal attention networks, and variability in behavioural responses to transcranial magnetic stimulation.Cortex. 2017 Jan;86:230-246. doi: 10.1016/j.cortex.2016.06.015. Epub 2016 Jun 25. Cortex. 2017. PMID: 27405259
-
Visual Short-Term Memory Activity in Parietal Lobe Reflects Cognitive Processes beyond Attentional Selection.J Neurosci. 2018 Feb 7;38(6):1511-1519. doi: 10.1523/JNEUROSCI.1716-17.2017. Epub 2018 Jan 8. J Neurosci. 2018. PMID: 29311140 Free PMC article.
-
Asymmetry and Structure of the Fronto-Parietal Networks Underlie Visuomotor Processing in Humans.Cereb Cortex. 2017 Feb 1;27(2):1532-1544. doi: 10.1093/cercor/bhv348. Cereb Cortex. 2017. PMID: 26759477
-
Brain connectivity and visual attention.Brain Connect. 2013;3(4):317-38. doi: 10.1089/brain.2012.0139. Epub 2013 Jun 8. Brain Connect. 2013. PMID: 23597177 Free PMC article. Review.
-
Frontoparietal cortical networks for directing attention and the eye to visual locations: identical, independent, or overlapping neural systems?Proc Natl Acad Sci U S A. 1998 Feb 3;95(3):831-8. doi: 10.1073/pnas.95.3.831. Proc Natl Acad Sci U S A. 1998. PMID: 9448248 Free PMC article. Review.
Cited by
-
Abnormal neurite density and orientation dispersion in frontal lobe link to elevated hyperactive/impulsive behaviours in young adults with traumatic brain injury.Brain Commun. 2022 Jan 30;4(1):fcac011. doi: 10.1093/braincomms/fcac011. eCollection 2022. Brain Commun. 2022. PMID: 35187485 Free PMC article.
-
Prefrontal transcranial direct current stimulation (tDCS) as treatment for major depression: study design and methodology of a multicenter triple blind randomized placebo controlled trial (DepressionDC).Eur Arch Psychiatry Clin Neurosci. 2017 Dec;267(8):751-766. doi: 10.1007/s00406-017-0769-y. Epub 2017 Feb 28. Eur Arch Psychiatry Clin Neurosci. 2017. PMID: 28246891 Clinical Trial.
-
Visuospatial processing in early brain-based visual impairment is associated with differential recruitment of dorsal and ventral visual streams.Cereb Cortex. 2024 May 2;34(5):bhae203. doi: 10.1093/cercor/bhae203. Cereb Cortex. 2024. PMID: 38795357 Free PMC article.
-
The status of the precommissural and postcommissural fornix in normal ageing and mild cognitive impairment: An MRI tractography study.Neuroimage. 2016 Apr 15;130:35-47. doi: 10.1016/j.neuroimage.2015.12.055. Epub 2016 Jan 9. Neuroimage. 2016. PMID: 26778129 Free PMC article.
-
Neuroplasticity enables bio-cultural feedback in Paleolithic stone-tool making.Sci Rep. 2023 Feb 18;13(1):2877. doi: 10.1038/s41598-023-29994-y. Sci Rep. 2023. PMID: 36807588 Free PMC article.
References
-
- Benjamini Y, Hochberg Y. Controlling the false discovery rate: a practical and powerful approach to multiple testing. J R Stat Soc B. 1995;57:289–300.
Publication types
MeSH terms
Grants and funding
LinkOut - more resources
Full Text Sources