. 2015 Jul 29;35(30):10659-74.
doi: 10.1523/JNEUROSCI.1629-15.2015.

Reelin Prevents Apical Neurite Retraction during Terminal Translocation and Dendrite Initiation

Affiliations

Reelin Prevents Apical Neurite Retraction during Terminal Translocation and Dendrite Initiation

Ryan S O'Dell et al. J Neurosci. .

Abstract

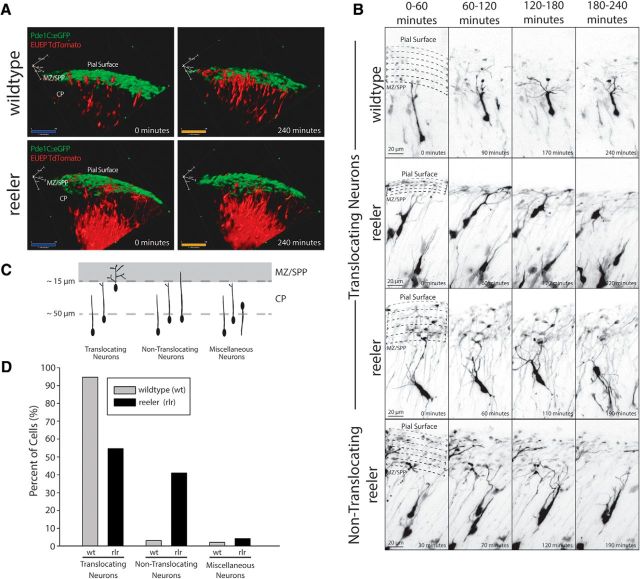
The mechanisms controlling cortical dendrite initiation and targeting are poorly understood. Multiphoton imaging of developing mouse cortex reveals that apical dendrites emerge by direct transformation of the neuron's leading process during the terminal phase of neuronal migration. During this ∼110 min period, the dendritic arbor increases ∼2.5-fold in size and migration arrest occurs below the first stable branch point in the developing arbor. This dendritic outgrowth is triggered at the time of leading process contact with the marginal zone (MZ) and occurs primarily by neurite extension into the extracellular matrix of the MZ. In reeler cortices that lack the secreted glycoprotein Reelin, a subset of neurons completed migration but then retracted and reorganized their arbor in a tangential direction away from the MZ soon after migration arrest. For these reeler neurons, the tangential oriented primary neurites were longer lived than the radially oriented primary neurites, whereas the opposite was true of wild-type (WT) neurons. Application of Reelin protein to reeler cortices destabilized tangential neurites while stabilizing radial neurites and stimulating dendritic growth in the MZ. Therefore, Reelin functions as part of a polarity signaling system that links dendritogenesis in the MZ with cellular positioning and cortical lamination.

Significance statement: Whether the apical dendrite emerges by transformation of the leading process of the migrating neuron or emerges de novo after migration is completed is unclear. Similarly, it is not clear whether the secreted glycoprotein Reelin controls migration and dendritic growth as related or separate processes. Here, multiphoton microscopy reveals the direct transformation of the leading process into the apical dendrite. This transformation is coupled to the successful completion of migration and neuronal soma arrest occurs below the first stable branch point of the nascent dendrite. Deficiency in Reelin causes the forming dendrite to avoid its normal target area and branch aberrantly, leading to improper cellular positioning. Therefore, this study links Reelin-dependent dendritogenesis with migration arrest and cortical lamination.

Keywords: dendritogenesis; lissencephaly; mental retardation; polarity.


Figures

Figure 1.
Figure 1.
Fewer translocating neurons are found in reeler cortices. A, Still frames of the entire image field at the first (0 min) and last acquisition (240 min) showing fewer translocating cells in the rlr explant compared with WT. eGFP-expressing (CR cells) are green in the MZ/SPP and tdTomato expressing early born neurons are red 2 d after E13 electroporation of Pde1C::eGFP transgenic embryos. B, A neuron in a WT explant shows continuous arbor growth in the MZ/SPP during the translocation period (1). In contrast, neurons in rlr explants show neurite retraction from the MZ/SPP in both translocating and nontranslocating neurons (2–4) (see Movies 1 and 2). C, Categories of neurons quantified in WT and reeler (rlr) mutant explants. Neurons were included for analysis if their leading process contacted the MZ/SPP within the first hour of imaging. The soma of translocating neurons attained a position <50 μm below the pial surface during the subsequent ∼3 h imaging period. D, 95% of WT neurons successfully translocated compared with only 55% of rlr neurons. Yates corrected χ2 = 38.8, p < 0.001. Dashed lines represent overlying pial surface in B and the lower boundaries of the MZ/SPP (∼15 μm) and CP (∼50 μm) in C. WT analysis: 95 neurons from 31 explants across 22 litters. Rlr analysis: 95 neurons from 17 explants across 14 litters. Scale bars: A, 50 μm; B, 20 μm. EUEP, ex utero electroporation.
Figure 2.
Figure 2.
Leading process growth and branching is disrupted in reeler cortices. A, Representations of flattened (z-projected) translocating and nontranslocating neurons in WT and rlr explants. B–D, Quantification of somal positioning and neurite morphology of translocating WT and rlr neurons after leading process contact with the M/SPP (t0). WT and rlr translocating neurons demonstrated similar translocation speed (B), arbor growth (C), and branch number increases (D, E) during the phases of pretranslocation and translocation and were characterized by a single, apically oriented primary process (E). During the immediate posttranslocation phase, however, WT arbors continued to branch from the single primary process into the overlying MZ/SPP, whereas rlr neurons collapsed and avoided the MZ/SPP, displaying significant increases in primary processes (i.e., multipolar) coupled with significant decreases in higher order branching (E). Interestingly, the pretranslocation phase of rlr neurons was characterized by an elevated number of primary process number (compared with WT controls), but these extra primaries were successfully retracted before the start of translocation (E). Nontranslocating WT and rlr neurons displayed larger and more highly branched, multipolar arbors than translocating neurons (B–E). These neurons showed abnormal arbor growth typically localized below the MZ/SPP. Dashed lines represent the lower boundary of the MZ/SPP (∼15 μm) and CP (∼50 μm) in A and B. Error bars denote SEM. Dashed lines represent the pial surface in D. Two-way ANOVA with post hoc Holm–Sidak pairwise multiple-comparison procedures were performed between genotypes and different phases of translocation on a per cell basis. *p < 0.05 compared with WT controls. Translocating WT analysis: 9 neurons from 8 explants across 8 litters. Translocating rlr analysis: 10 neurons from 8 explants across 8 litters. Nontranslocating WT analysis: 4 neurons from 4 explants across 4 litters. Nontranslocating rlr analysis: 9 neurons from 4 explants across 4 litters. Scale bars in A and D, 20 μm.
Figure 3.
Figure 3.
Correlation between long-lived neurite branch points and somata position. A, Representations of flattened (z-projected) translocating and nontranslocating WT and rlr early born neurons. The arrow identifies the longest-lived branch point and arrowheads represent transient primary and secondary branches. In all translocating neurons, ectopic branches emanating from the primary neurite but below the MZ/SPP were successfully resolved before somal passage, with final somal arrest occurring within one cell diameter below the longest-lived branch point. Nontranslocating WT and rlr neurons displayed ectopic long-lived primary and secondary branches below the MZ/SPP that correlated with ectopic somal positioning. B, Quantification of longest-lived branch point and somal position during imaging period. In nontranslocating WT and rlr neurons, the longest-lived branch point was localized to significantly deeper positions below the pial surface (nontranslocating WT 58.6 and rlr 56.6 μm) than in successfully translocating WT and rlr neurons (translocating WT 16.0 and rlr 23.4 μm, p < 0.001). Quantitative analysis was run on the same traced datasets presented in Figure 2. Dashed lines represent the lower boundaries of the MZ/SPP (∼15 μm) and CP (∼50 μm) in A and B. Error bars denote SEM. Three-way ANOVA with post hoc Holm–Sidak pairwise multiple-comparison procedures were performed between genotypes, category of neuron (translocating and nontranslocating), and acquisition time point (branch point appearance and end of translocation) on a per cell basis. Scale bar in A, 20 μm.
Figure 4.
Figure 4.
Postmigratory neurons show unstable neurites in reeler cortices. A, Representations of flattened (z-projected) postmigratory neurons in WT and rlr explants during a 4 h imaging period. Rlr neurons demonstrated multipolar morphologies and neurites that avoided the overlying MZ/SPP. B, Scatter plots of process lifetimes by branch order. C, Quantitative analysis on a per cell basis revealed significantly longer-lived primary, secondary, and tertiary processes in WT neurons with a prominent bimodal distribution of primary process lifetimes in the WT controls. D, Primary processes of rlr neurons had significantly shorter lifetimes in the MZ/SPP compared with both WT controls and rlr primary processes outside of the MZ/SPP. Total apical arbor size (E) and branch number (F) in WT neurons was observed to significantly increase over time, whereas rlr neurons only demonstrated slight but nonsignificant increases in arbor size and number. Although overall branch number was similar between WT and rlr arbors (F), the distribution of that branching was very different across branch orders (G). Rlr arbors demonstrated multipolar morphologies, characterized by more primary processes (interaction between genotype and time, p = 0.016) and reduced higher-order branching (interaction between genotype and time, p = 0.039) over time compared with WT controls. H, No differences were observed in total neurite initiation or retractions per hour between genotypes, but rlr neurons displayed significantly more primary process initiation and retraction events per hour and fewer tertiary and quaternary initiation and retraction events per hour compared with WT controls. Dashed lines in A represent the MZ-SPP/CP boundary. Error bars indicate SEM. For process lifetime analysis, two-way ANOVA with post hoc Holm–Sidak pairwise multiple-comparison procedures were performed on a per cell basis. For quantitative analysis of total apical arbor size and branch number, one- and two-way repeated-measures ANOVA with post hoc Holm–Sidak comparison procedures were performed over time. For analyses of initiation/retraction events by process order, three-way ANOVA with post hoc Holm–Sidak pairwise multiple-comparison procedures were performed on a per cell basis. *p < 0.05 compared with WT controls; #p < 0.05, denoting a significant trend over time. WT analysis: 13 neurons from 10 explants across 10 litters. rlr analysis: 10 neurons from 6 explants across 6 litters. Scale bar in A, 20 μm.
Figure 5.
Figure 5.
Reelin application causes rapid neuronal reorientation and radially directed dendritic growth in reeler cortices. A, Representations of flattened (z-projected) postmigratory neurons in WT and rlr explants before and after the application of Rln-CM. Before Rln-CM application, rlr neurons were misoriented and multipolar. After Rln-CM application, neurons retracted tangential primary processes (arrowheads) and elaborated a highly branched apical arbor into the overlying MZ/SPP (arrows; AC). Quantitative analysis of total apical arbor size (B) and branching (C) over time revealed significant increases in both measures after the application of Rln-CM, in addition to decreases in primary process number and increases in higher order branch number (D). Exogenous Reelin protein was detected in rlr explants after 1 h of Rln-CM perfusion at levels comparable to native Reelin protein in WT explants (E). Using an anti-Reelin antibody (CR50), exogenous Reelin was immunolocalized to the MZ/SPP in fixed rlr explants after 4 h of perfusion with Rln-CM (F). For both immunoblot (E) and immunofluorescence (F) assays, WT and rlr control explants were perfused for 4 h in medium that lacked Reelin before lysis or fixation. Dashed lines in A represent the MZ-SPP/CP boundary. Error bars indicate SEM. One-way repeated-measures ANOVA with post hoc Holm–Sidak multiple-comparison procedures were performed across time to determine any significant changes in total apical arbor growth (B) and branching (C) after Reelin application. #p < 0.01 denoting a significant change over time; *p < 0.05, compared with pre-Reelin application (110 min). rlr-Rescue analysis: 4 neurons from 4 explants across 4 litters. Scale bars in A and F, 20 μm.
Figure 6.
Figure 6.
Candidate contact areas between developing neurites and MZ/SPP axons are not affected by Reelin deficiency. A, No consistent areas of contact were observed between mRFP-expressing cortical neurites and eGFP-expressing cell bodies or dendrites of CR cells (Pde1C::eGFP transgenic embryo). CCA analysis identifies regions where mRFP-expressing cortical neurites (red) and Smi312-immunopositive MZ/SPP axons (green) cannot be spatially resolved (i.e., are within 790 nm). BD, CCAs are represented in white and superimposed over the mRFP+ signal (second column). CCA is higher in WT (B) compared with rlr mutant neurons (C) when the entire RFP+ arbor is analyzed (E). F, CCA analysis revealed no significant differences between WT and rlr neurons when analyses are restricted to MZ/SPP localized neurites. In addition, no significant differences in CCAs between WT and rlr explants were observed after z-stack shuffling of the dendrite, suggesting random dendrite/axon interactions account for measured the CCAs. As a positive control, CCA analysis was applied to mRFP+ leading processes apposed to nestin expressing radial glial fibers (D, F). This analysis revealed an expected high percentage of the leading process forming within CCAs, as well as a significant decrease when the leading process z-stack was randomly shuffled (F). Error bars indicate SEM. Two-way ANOVA was performed to assess CCA differences. *p < 0.05 compared with WT or non-z-shuffled controls. WT whole-field analysis: 22 image fields from 11 explants across 11 litters. WT MZ/SPP analysis: 22 image fields from 11 explants across 11 litters. rlr whole-field analysis: 13 image fields from 6 explants across 6 litters. rlr MZ/SPP analysis: 14 image fields from 7 explants across 7 litters. WT nestin control analysis: 37 leading processes from 5 explants across 5 litters. Scale bars in AD, 10 μm. Pde1C, Phosphodiesterase 1C.

Similar articles

Cited by

References

    1. Armstrong DD, Dunn K, Antalffy B. Decreased dendritic branching in frontal, motor and limbic cortex in Rett syndrome compared with trisomy 21. J Neuropathol Exp Neurol. 1998;57:1013–1017. doi: 10.1097/00005072-199811000-00003. - DOI - PubMed
    1. Barnes AP, Lilley BN, Pan YA, Plummer LJ, Powell AW, Raines AN, Sanes JR, Polleux F. LKB1 and SAD kinases define a pathway required for the polarization of cortical neurons. Cell. 2007;129:549–563. doi: 10.1016/j.cell.2007.03.025. - DOI - PubMed
    1. Bradke F, Dotti CG. Establishment of neuronal polarity: lessons from cultured hippocampal neurons. Curr Opin Neurobiol. 2000;10:574–581. doi: 10.1016/S0959-4388(00)00124-0. - DOI - PubMed
    1. Caviness VS., Jr Neocortical histogenesis in normal and reeler mice: a developmental study based upon [3H]thymidine autoradiography. Brain Res. 1982;256:293–302. - PubMed
    1. Caviness VS, Jr, Sidman RL. Time of origin or corresponding cell classes in the cerebral cortex of normal and reeler mutant mice: an autoradiographic analysis. J Comp Neurol. 1973;148:141–151. doi: 10.1002/cne.901480202. - DOI - PubMed

Publication types

LinkOut - more resources