. 2015 Jul 29;35(30):10685-700.
doi: 10.1523/JNEUROSCI.0222-15.2015.

Function and Circuitry of VIP+ Interneurons in the Mouse Retina

Affiliations

Function and Circuitry of VIP+ Interneurons in the Mouse Retina

Silvia J H Park et al. J Neurosci. .

Abstract

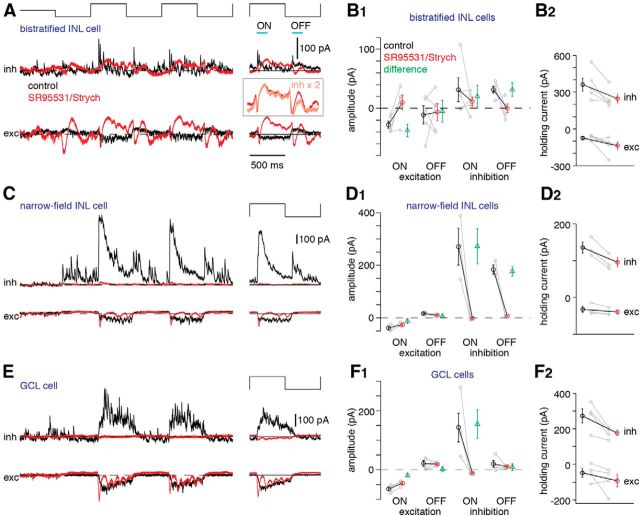
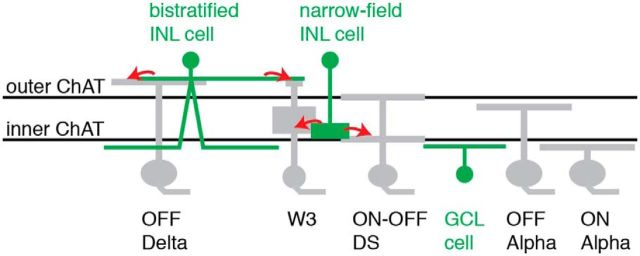
Visual processing in the retina depends on coordinated signaling by interneurons. Photoreceptor signals are relayed to ∼20 ganglion cell types through a dozen excitatory bipolar interneurons, each responsive to light increments (ON) or decrements (OFF). ON and OFF bipolar cell pathways become tuned through specific connections with inhibitory interneurons: horizontal and amacrine cells. A major obstacle for understanding retinal circuitry is the unknown function of most of the ∼30-40 amacrine cell types, each of which synapses onto a subset of bipolar cell terminals, ganglion cell dendrites, and other amacrine cells. Here, we used a transgenic mouse line in which vasoactive intestinal polypeptide-expressing (VIP+) GABAergic interneurons express Cre recombinase. Targeted whole-cell recordings of fluorescently labeled VIP+ cells revealed three predominant types: wide-field bistratified and narrow-field monostratified cells with somas in the inner nuclear layer (INL) and medium-field monostratified cells with somas in the ganglion cell layer (GCL). Bistratified INL cells integrated excitation and inhibition driven by both ON and OFF pathways with little spatial tuning. Narrow-field INL cells integrated excitation driven by the ON pathway and inhibition driven by both pathways, with pronounced hyperpolarizations at light offset. Monostratified GCL cells integrated excitation and inhibition driven by the ON pathway and showed center-surround spatial tuning. Optogenetic experiments showed that, collectively, VIP+ cells made strong connections with OFF δ, ON-OFF direction-selective, and W3 ganglion cells but weak, inconsistent connections with ON and OFF α cells. Revealing VIP+ cell morphologies, receptive fields and synaptic connections advances our understanding of their role in visual processing.

Significance statement: The retina is a model system for understanding nervous system function. At the first stage, rod and cone photoreceptors encode light and communicate with a complex network of interneurons. These interneurons drive the responses of ganglion cells, which form the optic nerve and transmit visual information to the brain. Presently, we lack information about many of the retina's inhibitory amacrine interneurons. In this study, we used genetically modified mice to study the light responses and intercellular connections of specific amacrine cell types. The results show diversity in the shape and function of the studied amacrine cells and elucidate their connections with specific types of ganglion cell. The findings advance our understanding of the cellular basis for retinal function.

Keywords: amacrine cell; optogenetics; receptive field; retinal circuitry; transgenic mice; vasoactive intenstinal polypeptide.


Figures

Figure 1.
Figure 1.
Expression pattern and regional density of VIP+ amacrine cells. A, Confocal fluorescence images of retinal sections. VIP antibody staining (green; A1) in a VIP-ires-Cre::Ai14 retina overlaps with red fluorescence in most cells (A2). A rare red cell lacking obvious antibody labeling is shown (arrowhead). All panels: scale bar, 20 μm. B, VIP+ cells (red) stratify in several layers relative to the cholinergic starburst amacrine cells, labeled with a ChAT antibody (green). Inner and outer ChAT bands are indicated. C, Labeling of GAD65/67 antibody (green; C1) includes VIP+ cells (red; arrowheads in C2) in a VIP-ires-Cre::Ai14 retina. Overlap is shown in C3. D–F, VIP+ cells (red) lack staining by antibodies against GlyT1 (green, D), tyrosine hydroxylase (TH; green, E), or CD15 (green, F). All sections show the INL. G, Cell counts from four quadrants (0.32 × 0.32 mm2 in-plane resolution), 0.5–1.0 mm from the optic disk. n indicates the number of retinas used for each cell count with both the Ai14 and Ai32 reporter lines. Error bars indicate ± 1 SEM across retinas.
Figure 2.
Figure 2.
Single-cell morphology reveals distinct types of VIP+ cell. A, Z-projection of confocal images of a dye-filled (Lucifer yellow) bistratified INL cell (A1; fluorescence inverted and converted to grayscale). Dendritic tree area is measured with a convex polygon (dashed line). Images represent two dendritic tiers, near the GCL (inner dendrites, A2) and the INL (outer dendrites, A3), respectively, with several long “tails” that emerge from the dense arborizations surrounding the cell body (red arrowheads, here and in B). B, A second bistratified INL cell labeled following viral delivery of Synaptophysin-YFP. C, D, Two narrow-field cells (dye-filled). E, A ganglion cell-layer cell (dye-filled). F, Image near the soma of an axon-bearing cell (F1; dye-filled) and a drawing of the entire field of processes (F2). G, Fluorescence profile of a VIP+ cell (green) is shown relative to the ChAT bands (magenta) and the approximate locations of the ganglion cell and inner nuclear layers (GCL, INL; shaded regions) (Tikidji-Hamburyan et al., 2015). ChAT band centers were normalized to 0 (inner band) and 1 (outer band). Arrows indicate peak fluorescence of the VIP+ dendrites (black). The three examples (cells shown in B, D, E) represent cells in each group. H, Scatter plot of dendritic field diameter versus normalized stratification for bistratified cells. Each cell was labeled by either dye fill (black) or viral transduction (red). The two peaks from a single cell are connected. Shaded regions represent areas in the two-dimensional space that include most cells. All cells but one bracket the ChAT bands. The one outlier (arrowheads) had an inner tier of dendrites between the ChAT bands. Histograms represent collapsed data along the two dimensions. I, Same format as H for monostratified cells. A narrow-field group (green shaded region) primarily stratified between the ChAT bands and adjacent to the inner ChAT band, whereas a second group (gray shaded region) stratified between the inner ChAT band and the GCL. Cells whose soma was in the GCL are represented by gray-filled circles. Two cells filled by virus labeling, but with somas in the INL, seemed to cluster with the GCL cells. The two multiaxonal cells were distinct from the narrow-field and GCL cell distributions (arrows; open circle is the cell in F). Orange outlines represent the positions of bistratified cell dendrites shown in H.
Figure 3.
Figure 3.
Patterns of synaptic excitation and inhibition in VIP+ cells. A, Left, Voltage-clamp recordings of excitatory current (exc; Vhold near inhibitory reversal, −67 mV) and inhibitory current (inh; Vhold near excitatory reversal, 0 mV) in a bistratified INL cell in response to a 1 Hz contrast-reversing spot (200 μm diameter, 100% contrast). Red traces represent the same measurements in the presence of antagonists to GABA-A (SR95531, 50 μm) and glycine receptors (strychnine, 1 μm). Traces have been baseline-subtracted. Horizontal dashed line indicates baseline (i.e., average current before the stimulus). Right, Average cycle of excitatory and inhibitory current, combined across two repeats at each of two holding potentials bracketing the appropriate reversal potential (see Materials and Methods). ON and OFF time windows (100–250 ms following either light onset or offset) indicate periods where current was averaged for population analysis (see B1). Inset, Average excitatory current (red) superimposed on the average inhibitory current scaled by a factor of 2 (orange; inh × 2). In the presence of drugs, the presumed inhibitory current resembled the excitatory current, and apparently reflects unclamped input through an electrical synapse (see Results). B1, Excitatory and inhibitory input in the ON and OFF time windows in A in control (black) and drug (red) conditions. Measurements from individual cells are shown in gray. Green points indicate the difference between control and drug conditions. Error bars indicate ±1 SEM across cells. Across cells, spot diameter was either 200 or 300 μm. B2, The holding current during measurements of excitatory and inhibitory current. Error bars indicate ±1 SEM across cells. C, D, Same format as A and B, but for narrow-field INL cells. E, F, Same format as A and B, but for GCL cells.
Figure 4.
Figure 4.
Bistratified INL cells electrically couple to VIP+ cells. A, Voltage-clamp recordings of a bistratified INL cell at three holding potentials. The gap junction blocker MFA had been applied for 15 min at the time of recording. B, Same cell as in A after adding the inhibitory receptor antagonists SR95531 and strychnine (as in Fig. 3). The gap junction blocker MFA had been applied for 20 min at the time of recording. The response near the excitatory reversal potential (Vhold = 10 mV) is nulled under these conditions, and the response near the inhibitory reversal potential (Vhold = −62 mV) is inverted at the positive holding potential (Vhold = 39 mV). C, Same as in B, but for a cell recorded in the inhibitory blockers without MFA (same cell as in Fig. 3A). The response does not reverse. D, Neurobiotin labeling following the injection of a bistratified INL VIP+ cell in a VIP-ires-Cre::Ai32 retina. Most somas labeled by Neurobiotin (NBT; magenta) had their membrane labeled by EYFP (arrows); one cell was Neurobiotin+ only (arrowhead). The image is from a single confocal section centered ∼150 μm from the soma of the injected bistratified INL cell.
Figure 5.
Figure 5.
Convergence of ON and OFF bipolar cell inputs to VIP+ cells. A, Left, Voltage-clamp recordings of excitatory current (exc; Vhold near inhibitory reversal, −67 mV) and inhibitory current (inh; Vhold near excitatory reversal, 0 mV) in a bistratified INL cell in response to a 1 Hz contrast-reversing spot (300 μm diameter, 100% contrast). Red traces represent the same measurements in the presence of l-AP4 (20 μm) to block the ON pathway. Excitatory current measured in the presence of l-AP4 is shown a second time for clarity, with an expanded scale (twice the originally plotted amplitude; inset in A). Light offset caused a sluggish inward current, consistent with OFF bipolar cell input; whereas light onset caused a small, sustained outward current accompanied by reduced synaptic noise (arrow), consistent with the suppression of basal excitatory input. Traces have been baseline-subtracted (baseline indicated by horizontal dashed line). Right, Average cycle of excitatory and inhibitory current, combined across two repeats at each of two holding potentials bracketing the appropriate reversal potential (see Materials and Methods). ON and OFF time windows indicate periods where current was averaged for population analysis (see B1). B1, Excitatory and inhibitory input in the ON and OFF time windows in A under control (black) and drug (red) conditions. Measurements from individual cells are shown in gray. Green points indicate the difference between control and drug conditions. Error bars indicate ±1 SEM across cells. Across cells, spot diameter was either 200 or 300 μm. B2, The holding current during measurements of excitatory and inhibitory current. Error bars indicate ±1 SEM across cells. C, D, Same format as A and B, but for narrow-field INL cells. E, F, Same format as A and B, but for GCL cells. For the example cell (E), the inhibitory current measured in the presence of l-AP4 is shown a second time for clarity, with an expanded scale (twice the originally plotted amplitude; inset).
Figure 6.
Figure 6.
Spatial tuning of synaptic inputs to VIP+ cells. A, VIP+ cell synaptic current responses to a 1 Hz contrast-reversing spot (100% contrast) of either 200 (dark blue) or 725 μm diameter (light blue). Traces have been baseline-subtracted (baseline, horizontal dashed line). Excitatory current was recorded near the reversal potential for inhibition, and vice versa. Panel represents two examples of bistratified INL cells with varying degrees of excitatory input at light offset. Bistratified INL cell 2 showed an obvious inward current at light offset for the small spot stimulus (arrowhead). B, Spatial tuning of excitatory current during the ON and OFF phases of the stimulus. Responses represent the average current within a 150 ms time window starting from the peak of the response amplitude, following light onset or offset (averaged over three cycles). Error bars indicate ±1 SEM across cells. C, Same format as B for the inhibitory current amplitude during ON and OFF phases of the stimulus, as a function of spot size. D, Input resistance for each of the three VIP+ cell types. Individual data for each type are shown next to the mean ± SEM across cells.
Figure 7.
Figure 7.
Spatial tuning of voltage responses in VIP+ cells. A, VIP+ cell membrane voltage responses to a 1 Hz contrast-reversing spot (100% contrast) of either 200 (dark blue) or 725 μm diameter (light blue). Traces have been baseline-subtracted (resting potential, horizontal dashed line). Panel represents two examples of bistratified INL cells with varying degrees of depolarization during light offset. Bistratified INL cell 2 depolarized at light offset for the small spot stimulus (arrowhead). B, Spatial tuning of membrane potential responses during the ON and OFF phases of the stimulus. Responses represent the average membrane potential within a 150 ms time window starting from the peak of the response amplitude, following light onset or offset (averaged over three cycles). Error bars indicate ±1 SEM across cells.
Figure 8.
Figure 8.
ChR2-mediated responses in VIP+ cells. A, Two-photon fluorescence recordings of iGluSnFR responses at multiple levels within the IPL (relative to GCL, 0% and INL, 100%). Each trace represents the fluorescence response to the ChR2 stimulus; a response to light onset is observed in an inner layer (35%; partly overlapping with stimulus presentation) and responses following light offset are observed in outer layers (70, 91%). Responses in control conditions are mostly blocked by DNQX (100 μm), l-AP4 (20 μm), and d-AP5 (100 μm), but transient OFF responses persisted at the 70% layer. These residual responses were eliminated by additional block with UBP310 (50 μm). B, Example responses (12 repeats) to ChR2 stimulation in a bistratified INL cell (light vs dark blue: 0.85 vs 5.3 × 10¹⁷ Q s−1 cm−2), a narrow-field INL, and a GCL cell (light vs dark blue: 0.74 vs 5.3 × 10¹⁷ Q s−1 cm−2). Responses were recorded in the presence of the blockers used in A (DNQX, l-AP4, d-AP5, UBP310). C, Population responses to various levels of ChR2 stimulation recorded in synaptic blockers, in each of three cell types (cyan points). Responses were averaged over a 200 ms time window during the sustained portion of the ChR2 response (20–220 ms after stimulus onset). For each cell type, the resting membrane potential in control medium (i.e., no synaptic blockers) is shown to the left of the resting potential in synaptic blockers (i.e., cyan point at 0 × 1017 Q s−1 cm−2). The range of membrane depolarization and hyperpolarization in response to spot stimuli (from Fig. 7) is shown, with a connected line, to the right of the maximal ChR2 response; these data represent the maximum and minimum voltage measured across all spot sizes at the sampling rate (i.e., not averaged within a time window). Error bars indicate ± 1 SEM across cells. In the case of bistratified INL cells, depolarization to maximum ChR2 stimulus exceeded the maximum depolarization to spot stimuli. *p < 0.001.
Figure 9.
Figure 9.
Optogenetic studies of VIP+ cell connections to five ganglion cell types. A, Inhibitory currents recorded in an OFF δ ganglion cell in the VIP-ires-Cre::Ai32 retina during ChR2 stimulation of VIP+ cells. Individual trials show a high level of synaptic noise at baseline accompanied by responses at two levels of ChR2 stimulation. Mean traces (bottom) represent the average across 12 repeats. The response to maximal ChR2 stimulation was blocked by the GABA-A receptor antagonist SR95531 (50 μm). Dashed line in each case indicates the baseline current before ChR2 stimulation. All recordings were performed in the presence of the blockers described in Figure 8 (DNQX, l-AP4, d-AP5, UBP310). B, Same format as A for an ON-OFF DS ganglion cell. Here, spontaneous inhibitory activity is minimal, and weak ChR2 stimulation evoked apparent summation of several individual synaptic events. The strong ChR2-mediated response was blocked by SR95531. C, Same format as A for a W3 ganglion cell labeled in a VIP-ires-Cre::Ai32::TYW3 retina. As in B, there is minimal spontaneous inhibitory activity at baseline and individual events can be resolved during weak ChR2 stimulation. For clarity, the mean inhibitory current to weak stimulation is plotted a second time with an expanded vertical scale (gray). D, OFF α ganglion cell response to strong ChR2 stimulation. A small inhibitory current was observed that was blocked by SR95531. SR95531 did not block the spontaneous inhibitory input, suggesting that its origin was glycinergic. E, Same format as D for an ON α cell. A small ChR2-mediated inhibitory current is observed to maximal ChR2 stimulation. F, Average inhibitory current to maximal ChR2 stimulation (5.3 × 10¹⁷ Q s−1 cm−2) for each ganglion cell type. Individual cells are shown (circles) next to the population mean. Error bars indicate ±1 SEM across cells. Significant responses are indicated as follows: *p < 0.05. **p < 0.01. G, Average inhibitory current to varying levels of ChR2 stimulation in each cell type. Error bars indicate ±1 SEM across cells (n = 3 or more cells per point).
Figure 10.
Figure 10.
Circuit diagrams for VIP+ cells. Proposed synaptic output of the three major VIP+ cell types. Bistratified INL cells are positioned near the INL, where they make synapses with OFF δ ganglion cells and W3 cells. Narrow-field INL cells make inhibitory synapses with both W3 and ON-OFF DS cells near the inner ChAT band. GCL cells are positioned near the ON α ganglion cell dendrites but apparently do not provide substantial synaptic output to either the ON α or any of the other ganglion cell types shown here.

Similar articles

Cited by

References

    1. Applebury ML, Antoch MP, Baxter LC, Chun LL, Falk JD, Farhangfar F, Kage K, Krzystolik MG, Lyass LA, Robbins JT. The murine cone photoreceptor: a single cone type expresses both S and M opsins with retinal spatial patterning. Neuron. 2000;27:513–523. doi: 10.1016/S0896-6273(00)00062-3. - DOI - PubMed
    1. Arai I, Yamada Y, Asaka T, Tachibana M. Light-evoked oscillatory discharges in retinal ganglion cells are generated by rhythmic synaptic inputs. J Neurophysiol. 2004;92:715–725. doi: 10.1152/jn.00159.2004. - DOI - PubMed
    1. Badea TC, Nathans J. Quantitative analysis of neuronal morphologies in the mouse retina visualized by using a genetically directed reporter. J Comp Neurol. 2004;480:331–351. doi: 10.1002/cne.20304. - DOI - PubMed
    1. Baden T, Schubert T, Chang L, Wei T, Zaichuk M, Wissinger B, Euler T. A tale of two retinal domains: near-optimal sampling of achromatic contrasts in natural scenes through asymmetric photoreceptor distribution. Neuron. 2013;80:1206–1217. doi: 10.1016/j.neuron.2013.09.030. - DOI - PubMed
    1. Beier KT, Borghuis BG, El-Danaf RN, Huberman AD, Demb JB, Cepko CL. Transsynaptic tracing with vesicular stomatitis virus reveals novel retinal circuitry. J Neurosci. 2013;33:35–51. doi: 10.1523/JNEUROSCI.0245-12.2013. - DOI - PMC - PubMed

Publication types

Substances