. 2015 Jul 29;35(30):10773-85.
doi: 10.1523/JNEUROSCI.0099-15.2015.

Differential Muscarinic Modulation in the Olfactory Bulb

Affiliations

Differential Muscarinic Modulation in the Olfactory Bulb

Richard S Smith et al. J Neurosci. .

Abstract

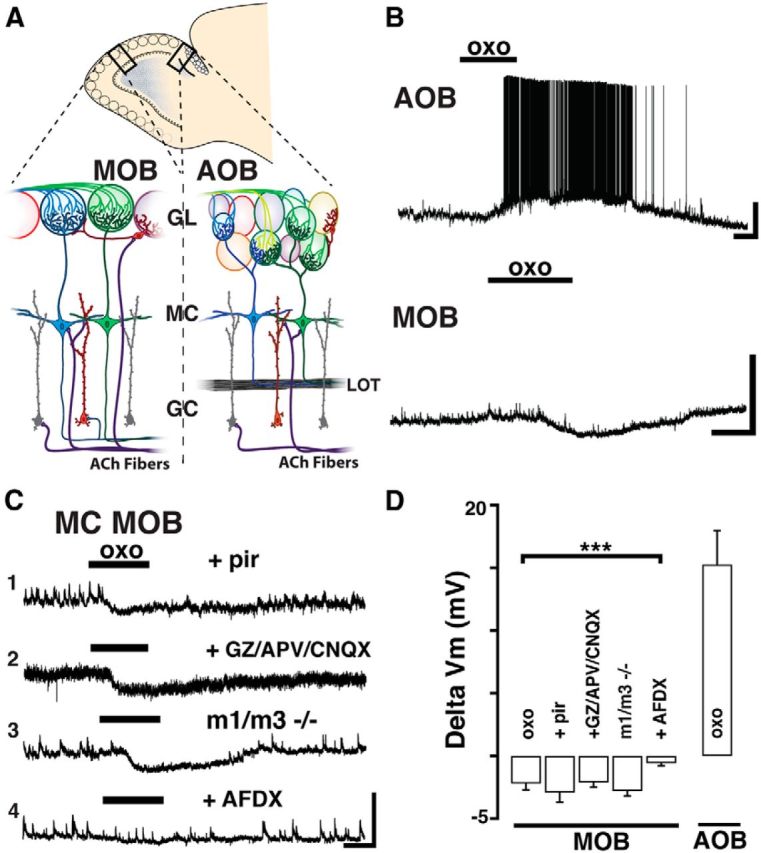
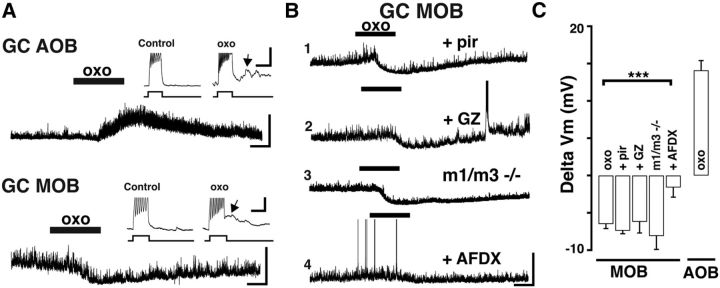
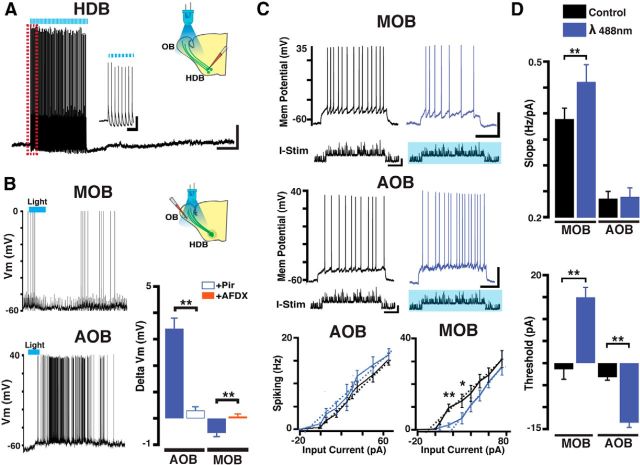
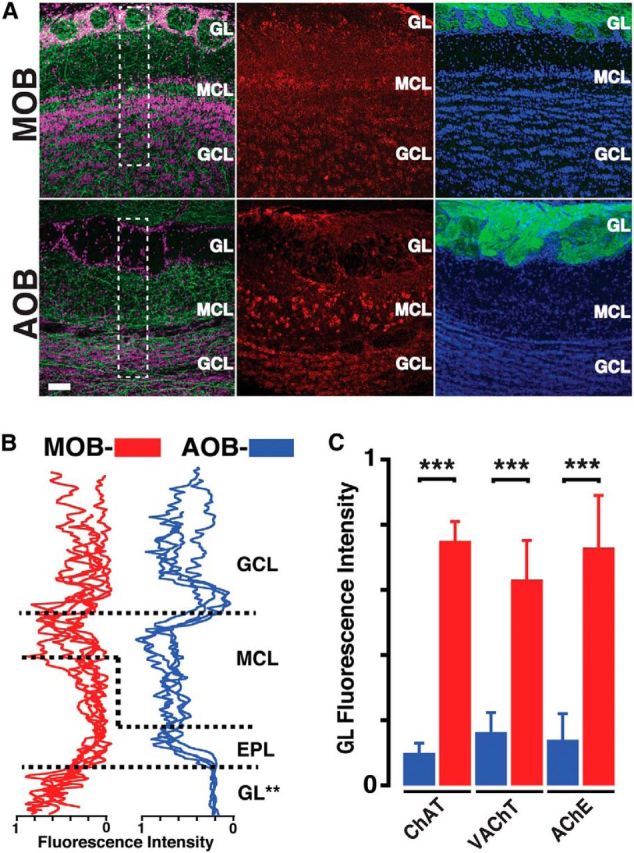
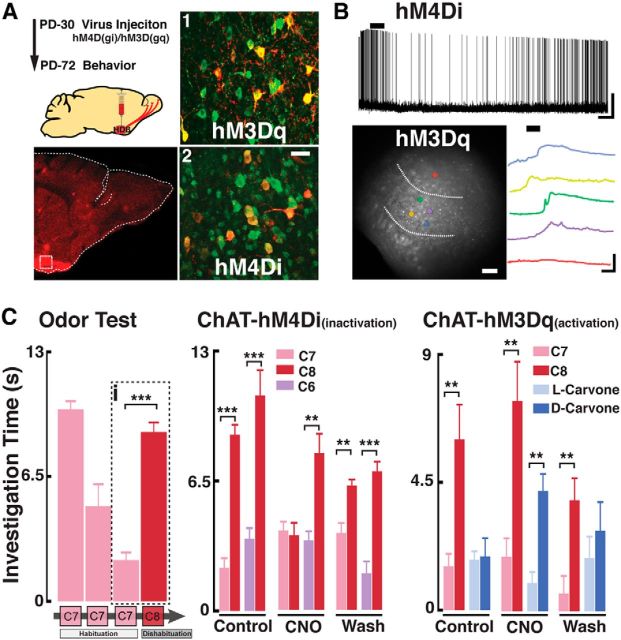
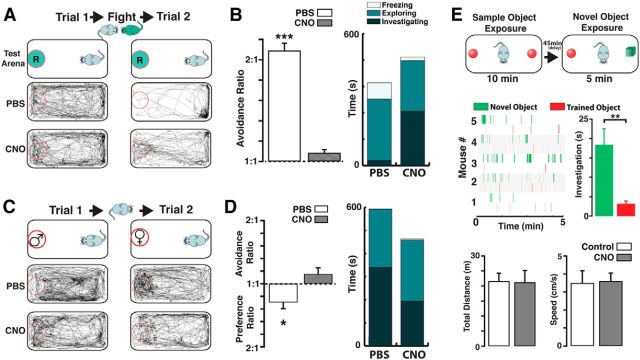
Neuromodulation of olfactory circuits by acetylcholine (ACh) plays an important role in odor discrimination and learning. Early processing of chemosensory signals occurs in two functionally and anatomically distinct regions, the main and accessory olfactory bulbs (MOB and AOB), which receive extensive cholinergic input from the basal forebrain. Here, we explore the regulation of AOB and MOB circuits by ACh, and how cholinergic modulation influences olfactory-mediated behaviors in mice. Surprisingly, despite the presence of a conserved circuit, activation of muscarinic ACh receptors revealed marked differences in cholinergic modulation of output neurons: excitation in the AOB and inhibition in the MOB. Granule cells (GCs), the most abundant intrinsic neuron in the OB, also exhibited a complex muscarinic response. While GCs in the AOB were excited, MOB GCs exhibited a dual muscarinic action in the form of a hyperpolarization and an increase in excitability uncovered by cell depolarization. Furthermore, ACh influenced the input-output relationship of mitral cells in the AOB and MOB differently showing a net effect on gain in mitral cells of the MOB, but not in the AOB. Interestingly, despite the striking differences in neuromodulatory actions on output neurons, chemogenetic inhibition of cholinergic neurons produced similar perturbations in olfactory behaviors mediated by these two regions. Decreasing ACh in the OB disrupted the natural discrimination of molecularly related odors and the natural investigation of odors associated with social behaviors. Thus, the distinct neuromodulation by ACh in these circuits could underlie different solutions to the processing of general odors and semiochemicals, and the diverse olfactory behaviors they trigger.

Significance statement: State-dependent cholinergic modulation of brain circuits is critical for several high-level cognitive functions, including attention and memory. Here, we provide new evidence that cholinergic modulation differentially regulates two parallel circuits that process chemosensory information, the accessory and main olfactory bulb (AOB and MOB, respectively). These circuits consist of remarkably similar synaptic arrangement and neuronal types, yet cholinergic regulation produced strikingly opposing effects in output and intrinsic neurons. Despite these differences, the chemogenetic reduction of cholinergic activity in freely behaving animals disrupted odor discrimination of simple odors, and the investigation of social odors associated with behaviors signaled by the Vomeronasal system.

Keywords: accessory olfactory bulb; aggression; cholinergic; muscarinic; olfactory; social behavior.


Figures

Figure 1.
Figure 1.
Muscarinic receptor activation produces opposite effects on mitral cells of the AOB and MOB. A, Diagram of a sagittal view of the OB. Magnified sections enclosed by the black rectangles are shown below. Left, MOB. Right, AOB. In the glomerular layer (GL), sensory axons (green and blue) relay information to output neurons residing in the MCs (blue and green). GCs (red and gray) are the most abundant cells in the MOB and AOB and form dendrodendritic synapses with MCs, influencing bulbar output through GABAergic inhibition. Cholinergic fibers arising from the basal forebrain (ACh fibers, purple) innervate both the MOB and AOB. LOT, Lateral olfactory tract. B, Current-clamp recordings from MCs shows opposite effects of the muscarinic ACh receptor (mAChR) agonist oxotremorine (oxo,10 μm, here and in all figures); a depolarization in the AOB (top) and hyperpolarization in the MOB (bottom); the resting membrane potential in these MCs is −57 and −59 mV, respectively. Calibration: top, 20 mV, 1 min; bottom, 10 mV, 1 min. C, Examples of responses to oxo in MOB MCs under different conditions. C1, The hyperpolarizing response to oxo is unchanged in the presence of M1-mAChR antagonist pirenzepine (Pir, 300 nm, Vm = −59 mV) or in the presence of ionotropic glutamate receptor (iGluR) blockers and GABA antagonist (C2, APV 100 μm, CNQX 10 μm, and GABAzine 5 μm, Vm = −55 mV). C3, The hyperpolarization persisted in MOB MCs from M1/M3−/− KO mice (Vm = −58 mV). However, the oxo-induced hyperpolarization is abolished in the presence of an M2-mAChR antagonist AFDX-116 (C4, 300 nm, Vm = −57). Calibration: all traces, 10 mV, 1 min. D, Summary of the effects produced by oxo on MC excitability in the MOB and AOB. The muscarinic hyperpolarization in MOB MCs is sensitive to AFDX-116. ***p < 0.01.
Figure 2.
Figure 2.
Activation of M2 muscarinic receptors hyperpolarizes MOB GCs. A, Current-clamp recordings from GCs showing opposite muscarinic effects in the AOB and MOB. In the AOB (top) oxo produces a depolarization, whereas in the MOB (bottom) oxo produces a hyperpolarization. Vm = −62 mV (top) and Vm = −61 mV (bottom). Calibration: 20 mV, 1 min. Inset, The 25 pA current injections reveal an increase in excitability and the appearance of a sADP (arrows). Calibration: 5 mV, 0.5 s. B, Examples of responses to oxo in MOB GCs under different conditions. B1, The hyperpolarization was not affected by Pir (300 nm, Vm = −61 mV) or by the GABA antagonist GABAzine (B2, GABAzine, 5 μm, Vm = −62 mV). B3, oxo still produced a robust hyperpolarization in M1/M3−/− KO mice (Vm = −60 mV). However, the hyperpolarization was abolished in the presence of the M2-mAChR antagonist AFDX-116 (B4, 300 nm, Vm = −61 mV). Calibration: all traces, 20 mV, 1 min. C, Summary of the properties of muscarinic response of GCs in the MOB and AOB. The muscarinic hyperpolarization in MOB GCs is sensitive to AFDX-116. ***p < 0.01.
Figure 3.
Figure 3.
Optogenetic activation of HDB cholinergic projections reveals opposing actions of acetylcholine on output neurons of the AOB and MOB. A, Current-clamp recording in a ChAT-ChR-YFP+ neuron in the HDB; consecutive stimulation pulses with blue light (λ 488 nm, blue bar, 10 Hz, 50 ms, 30 s) reliably excited this neuron. Calibration: 20 mV, 1 min. Left inset, Expanded time scale showing the light-evoked action potentials during the time highlighted by the red rectangle; all light pulses induced an action potential in this cell. Calibration: 20 mV, 400 ms. Vm = −60 mV. B, Top, Current-clamp recording from a MC in the MOB; optogenetic stimulation (10 Hz, 50 ms duration, 15 s) of ChAT-ChR fibers revealed a small hyperpolarization (Vm = −59 mV). Bottom, Recording from an MC in the AOB; optogenetic stimulation produced a depolarization of this MC (Vm = −62 mV). Bar graph represents a summary of the pharmacology of the optogenetically elicited responses in MCs. The depolarization in the AOB is abolished by Pir (300 nm), whereas the hyperpolarization on the MOB is sensitive to AFDX. A, B, Right diagrams represent the recording configuration indicating the position of the light stimulus in relation of to the recorded cell (i.e., HDB vs OB). C, Current-clamp recording of an MC in the MOB (top) and in the AOB (bottom). Neuronal spiking was elicited by injection of modeled excitatory synaptic currents overlying square current pulses (I-Stim; see Materials and Methods), in control (black traces) and in the presence of light stimulation (blue traces). The stimulus duration is 2 s, and the amplitude is 25 pA in the MOB and 15 pA in the AOB (Vm = −58 mV and Vm = −60 mV in the MOB and AOB, respectively). Bottom, Average firing frequency of MCs in response to increasing current stimuli in the AOB (left) and MOB (right). Dotted lines (black represents control; blue represents light stim) indicate the best fit to the rising phase of the current-voltage curves. D, Top, Quantification of the gain, measured by the slope (Hz/pA) of the curves shown in C. Bottom, quantification of MC spiking threshold obtained from the x-intercept (pA) of the regression fit to the slope of the relationships shown in C. *p < 0.05. **p < 0.02.
Figure 4.
Figure 4.
Cholinergic afferent fiber density is differentially distributed in the AOB and MOB. A, High-magnification confocal images of the MOB (top) and AOB (bottom) sections stained for different markers. Left, Sections from a ChAT-Tau-GFP mouse brain, stained with anti-GFP (green) and nuclear stain TOPRO (pink). The ChAT-GFP fibers are found in all layers of the MOB but are absent in the GL of the AOB. Middle, Sections from a wild-type mouse brain stained with anti-VAChT (red). The VAChT staining is prominent in the MOB GL but not in the AOB. Right, Sections from an OMP-YFP mouse, stained with anti-GFP (green) and DAPI (blue). There is abundant labeling in the glomerular layers of the MOB and AOB. Scale bar, 50 μm. B, Fluorescence intensity line plots from the regions outlined in A (white dotted rectangles; see Materials and Methods) for the MOB (red) and AOB (blue). Each line indicates sections obtained from different animals. In all sections, the intensity is lowest in the GL of the AOB. C, Bar graph represents normalized fluorescence intensity in the GL of MOB (red) and AOB (blue) for different cholinergic markers. All the markers show low intensity in the AOB. **p < 0.02. ***p < 0.01.
Figure 5.
Figure 5.
In vivo modification of HDB cholinergic neuron activity affects natural odor discrimination. A, Top left, Schematic diagram for the virus injection and behavioral testing schedule. Bottom left, Confocal image of a sagittal section of the OB from a ChAT-Cre mouse expressing hM4Di (red, mCherry) in the HDB. Dotted box represents the region shown on the right pictures (1,2). A1, A2, Magnified HDB sections immunostained for ChAT (green) and mCherry (red) showing colocalization (yellow) with hM3Dq (1) and hM4Di (2). Scale bar, 25 μm. B, Top, Recording from an HDB neuron expressing the hM4Di DREADD in the presence of iGluR blockers (APV 100 μm, CNQX 10 μm) and GABAzine (5 μm). Application of CNO (5 μm) produced a hyperpolarization in this cell (Vm = −54 mV). Calibration: 20 mV, 1 min. Bottom left, HDB neurons expressing the hM3Dq DREADD, loaded with the calcium dye Fluo-4. Dotted lines outline the HDB. Colored circles represent selected cells within the HDB (yellow, green, blue, and purple) responding to CNO. Red circle represents a cell outside the HDB. Bottom right, Optical recording traces color-coded to the cells shown on the left; cells in the HDB show an increase in calcium signal in the presence of CNO (5 μm). Calibration: 10% ΔF/F0, 2 min. C, Left, Habituation/dishabituation protocol used to test natural discrimination of odors. Mice presented with the same odor (i.e., ethyl heptanoate, C7, pink) three times show a decrease in investigation time (habituation). On the fourth trial, a novel odor (i.e., ethyl octanoate, C8, red) is presented and investigation time increases (dishabituation). The dotted box (i) highlights the quantification of habituation/dishabituation for this odor set (C7/C8), which is used to determine the discrimination of odors pairs in the middle and right graphs. Middle, ChAT-hM4Di mice were tested for natural discrimination of the C7/C8 (pink/red) and C6/C8 (purple/red) odor pairs (ethyl hexanoate, C6, purple). Odor discrimination was assessed before CNO injection (Control, PBS injected), CNO injection (CNO), and 5 h after CNO (Wash). Right, ChAT-hM3Dq mice were similarly tested for olfactory discrimination with the C7/C8 odor pair and carvone isomers: dark blue represents l-carvone; light blue represents d-carvone. **p < 0.02. ***p < 0.01.
Figure 6.
Figure 6.
Chemogenetic silencing of cholinergic neurons disrupts investigation of social odors. A, Top, Schematic illustration of the behavior paradigm used for the aggression-induced olfactory avoidance (see Materials and Methods). Before the aggressive encounter, a ChAT-hM4Di intruder (light blue) is placed in a neutral environment (Trial 1, 15 min), containing a dish with the soiled bedding from a resident (green circle marked “R”). Following the aggressive encounter, in which the intruder loses the fight, the same odor presentation is repeated (Trial 2, 15 min). Bottom, Movement trajectories during Trials 1 and 2, before the fight mice injected with PBS show no preference for a particular region of the neutral environment (left). After the fight, the mice spend most of the time avoiding the dish containing the resident's bedding (right). Following the fight, mice injected with CNO in the presence of the resident's bedding show no avoidance. B, Left, The avoidance ratio is significantly larger for the PBS-treated mice (white bar) compared with the CNO group (gray bar). Right, Stacked bar graph represents the average freezing (white), exploration (light green), and investigating (dark green) times, after fight (Trial 2) for PBS and CNO group. C, Top, Schematic illustration for the assessment of female odor preference (see Materials and Methods). During the first trial (Trial 1, 15 min), a ChAT-hM4Di male mouse is presented with a dish containing male-soiled bedding (red circle marked “♂”), whereas in the second trial (Trial 2, 15 min), the mouse is presented with a dish containing a female's soiled bedding (red circle marked “♀”). Bottom, Movement trajectories during Trials 1 and 2. In the presence of male bedding, mice injected with PBS navigate throughout the neutral environment indiscriminately (left). In the presence of female bedding, males spend significantly more time investigating the dish. In mice injected with CNO, the movement trajectories show decreased preference for a female's bedding. D, Left, The preference ratio is significant in the PBS-treated mice (white bar), whereas the CNO-treated mice show no preference, instead show a small but nonsignificant avoidance ratio (gray). Right, Stacked bar graph represents the average time spent by mice exhibiting freezing (white), exploration (light green), and investigation (dark green) behaviors during Trial 2 for the PBS and CNO groups. E, Top, Schematic illustration for the novel object recognition task. The trained object (red) consisted of a marble while the novel object was a cube (green, see Materials and Methods). Middle, Raster plots for the investigation events of the novel object in different ChAT-hM4Di mice injected with CNO. The mice spend a significant amount of time investigating the novel object. Bottom, The exploratory distance (left) and the average speed during the task is not affected by CNO. *p < 0.05; **p < 0.02; ***p < 0.01.

Similar articles

Cited by

References

    1. Armbruster BN, Li X, Pausch MH, Herlitze S, Roth BL. Evolving the lock to fit the key to create a family of G protein-coupled receptors potently activated by an inert ligand. Proc Natl Acad Sci U S A. 2007;104:5163–5168. doi: 10.1073/pnas.0700293104. - DOI - PMC - PubMed
    1. Baum MJ, Cherry JA. Processing by the main olfactory system of chemosignals that facilitate mammalian reproduction. Horm Behav. 2015;68:53–64. doi: 10.1016/j.yhbeh.2014.06.003. - DOI - PubMed
    1. Bevins RA, Besheer J. Object recognition in rats and mice: a one-trial non-matching-to-sample learning task to study “recognition memory.”. Nat Protoc. 2006;1:1306–1311. doi: 10.1038/nprot.2006.205. - DOI - PubMed
    1. Bloom FE, Costa E, Salmoiraghi GC. Analysis of individual rabbit olfactory bulb neuron responses to microelectrophoresis of acetylcholine norepinephrine + serotonin synergists + antagonists. J Pharmacol Exp Ther. 1964;146:16–23. - PubMed
    1. Brennan PA, Kendrick KM. Mammalian social odours: attraction and individual recognition. Philos Trans R Soc Lond B Biol Sci. 2006;361:2061–2078. doi: 10.1098/rstb.2006.1931. - DOI - PMC - PubMed

Publication types

LinkOut - more resources