. 2015 Mar;4(3):e00013.
doi: 10.1002/psp4.13. Epub 2015 Mar 12.

Physiologically Based Pharmacokinetic Modeling of Fluorescently Labeled Block Copolymer Nanoparticles for Controlled Drug Delivery in Leukemia Therapy

Affiliations

Physiologically Based Pharmacokinetic Modeling of Fluorescently Labeled Block Copolymer Nanoparticles for Controlled Drug Delivery in Leukemia Therapy

M J Gilkey et al. CPT Pharmacometrics Syst Pharmacol. 2015 Mar.

Abstract

A physiologically based pharmacokinetic (PBPK) model was developed that describes the concentration and biodistribution of fluorescently labeled nanoparticles in mice used for the controlled delivery of dexamethasone in acute lymphoblastic leukemia (ALL) therapy. The simulated data showed initial spikes in nanoparticle concentration in the liver, spleen, and kidneys, whereas concentration in plasma decreased rapidly. These simulation results were consistent with previously published in vivo data. At shorter time scales, the simulated data predicted decrease of nanoparticles from plasma with concomitant increase in the liver, spleen, and kidneys before decaying at longer timepoints. Interestingly, the simulated data predicted an unaccounted accumulation of about 50% of the injected dose of nanoparticles. Incorporation of an additional compartment into the model justified the presence of unaccounted nanoparticles in this compartment. Our results suggest that the proposed PBPK model can be an excellent tool for prediction of optimal dose of nanoparticle-encapsulated drugs for cancer treatment.


Figures

Figure 1
Figure 1
Concentration profile of nanoparticles in the plasma vs. time over all timepoints. The solid circles denote experimental data, and the continuous curve represents the simulated data. Note the good agreement between experimental data and predicted model at t <2 hours and t >6 hours.
Figure 2
Figure 2
Biodistribution data and physiologically based pharmacokinetic (PBPK) nanoparticle model on short time scale (up to 48 hours) including the: (a) liver, (b) spleen, and (c) kidneys. The solid circles denote experimental data, and the continuous curve represents the simulated data. Note the close fit between experimental values and predicted values. A small deviation (0.6 mcg/mL) of 1,1′-Dioctadecyl-3,3,3′,3′-Tetramethylindotricarbocyanine Iodide dye-encapsulated nanoparticles (DiR-NPs) that exists between simulated and actual data is within the experimental error.
Figure 3
Figure 3
Biodistribution data and physiologically based pharmacokinetic (PBPK) nanoparticle model on long time scale (up to 14 days) including the: (a) liver, (b) spleen, and (c) kidneys. The solid circles denote experimental data, and the continuous curve represents the simulated data. Note the perfect fit between experimental and simulated values.
Figure 4
Figure 4
Flow diagram of the compartmentalized model. Note inclusion of a virtual organ referred to as the “other” compartment, and denoted “o” incorporated into the model.
Figure 5
Figure 5
Biodistribution data and physiologically based pharmacokinetic (PBPK) nanoparticle model on short and long time scale for the “other” compartment or “o.” Note the sudden increase in the 1,1′-Dioctadecyl-3,3,3′,3′-Tetramethylindotricarbocyanine Iodide dye-encapsulated nanoparticle (DiR-NP) concentration at the shorter time scale (a) and exponential decay at the longer time scale (b).
Figure 6
Figure 6
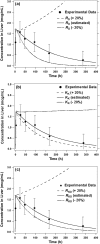
Sensitivity analysis showing the effect of perturbing RO by ±20%. The solid circles denote experimental data and the continuous lines represent the simulated data. The broken and the partially broken lines denote change in 1,1′-Dioctadecyl-3,3,3′,3′-Tetramethylindotricarbocyanine Iodide dye-encapsulated nanoparticle (DiR-NP) concentration by perturbations of each parameter by ±20%, respectively. The plots a, b, and c show the sensitivity of the DiR-NP concentration in the liver to perturbation for three different parameters. Each parameter was perturbed by ±20% and their effect on the liver concentration is shown. Note that the sensitivity of the concentration in the liver causes instability beyond experimentally determined error for each parameter.

References

    1. Bischoff KB, Dedrick RL, Zaharko DS. Longstreth JA. Methotrexate pharmacokinetics. J Pharm. Sci. 1971;60:1128–1133. - PubMed
    1. Jones H. Rowland-Yeo K. Basic concepts in physiologically based pharmacokinetic modeling in drug discovery and development. CPT Pharmacometrics Syst. Pharmacol. 2013;2:e63. - PMC - PubMed
    1. Rowland M, Balant L. Peck C. Physiologically based pharmacokinetics in drug development and regulatory science: a workshop report (Georgetown University, Washington, DC, 29–30 May 2002) AAPS J. 2004;6:56–67. - PMC - PubMed
    1. Bischoff KB. Physiological pharmacokinetics. Bull. Math. Biol. 1986;48:309–322. ) - PubMed
    1. Li M, Al-Jamal KT, Kostarelos K. Reineke J. Physiologically based pharmacokinetic modeling of nanoparticles. ACS Nano. 2010;4:6303–6317. - PubMed

LinkOut - more resources