

doi: 10.1002/psp4.21.
Epub 2015 Mar 18.
Interactive Pharmacometric Applications Using R and the Shiny Package
Affiliations
- PMID: 26225240
- PMCID: PMC4394611
- DOI: 10.1002/psp4.21
Item in Clipboard
Interactive Pharmacometric Applications Using R and the Shiny Package
CPT Pharmacometrics Syst Pharmacol.
2015 Mar.
Abstract
Interactive applications, developed using Shiny for the R programming language, have the potential to revolutionize the sharing and communication of pharmacometric model simulations. Shiny allows customization of the application's user-interface to provide an elegant environment for displaying user-input controls and simulation output-where the latter simultaneously updates with changing input. The flexible nature of the R language makes simulations of population variability possible thus promoting the combination of Shiny with R in model visualization.
Figures
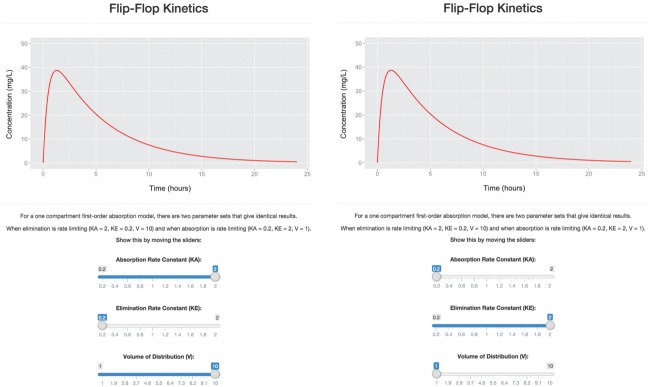
Flip-Flop Kinetics application. Shown are screenshots of the application featuring a one-compartment first-order absorption model running in a browser-window. The calculated concentration–time profile over 24 h is plotted as a red solid line. Left: Upon application initiation, elimination is rate limiting, with slider values of absorption rate constant (KA) = 2, elimination rate constant (KE) = 0.2, volume of distribution (V) = 10. Right: The slider values for KA and KE have been reversed where KA = 0.2 and KE = 2, i.e., absorption is rate limiting. For pairs of values to give identical results, the slider for V also needs to be changed (V is a scalar that allows the same numerical solution).
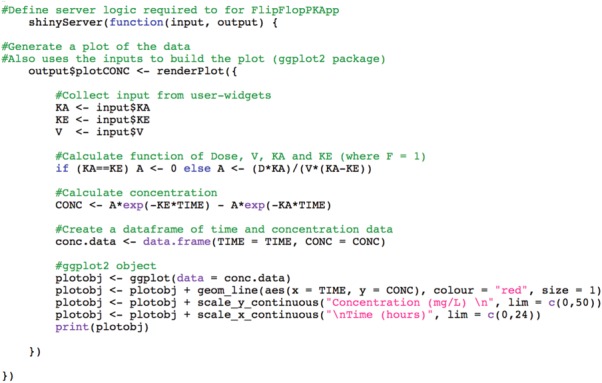
server.R excerpt from flip-flop kinetics application. The output object, plotCONC, uses the renderPlot function to call widget values for absorption rate constant (KA), elimination rate constant (KE), and volume of distribution (V) from the user-interface, creates a data frame consisting of drug concentrations (CONC) at each specified time-point (TIME; time sequence not shown), and plots the concentration–time profile using the ggplot2 package. As output and the renderPlot function are reactive, they are placed within shinyServer.
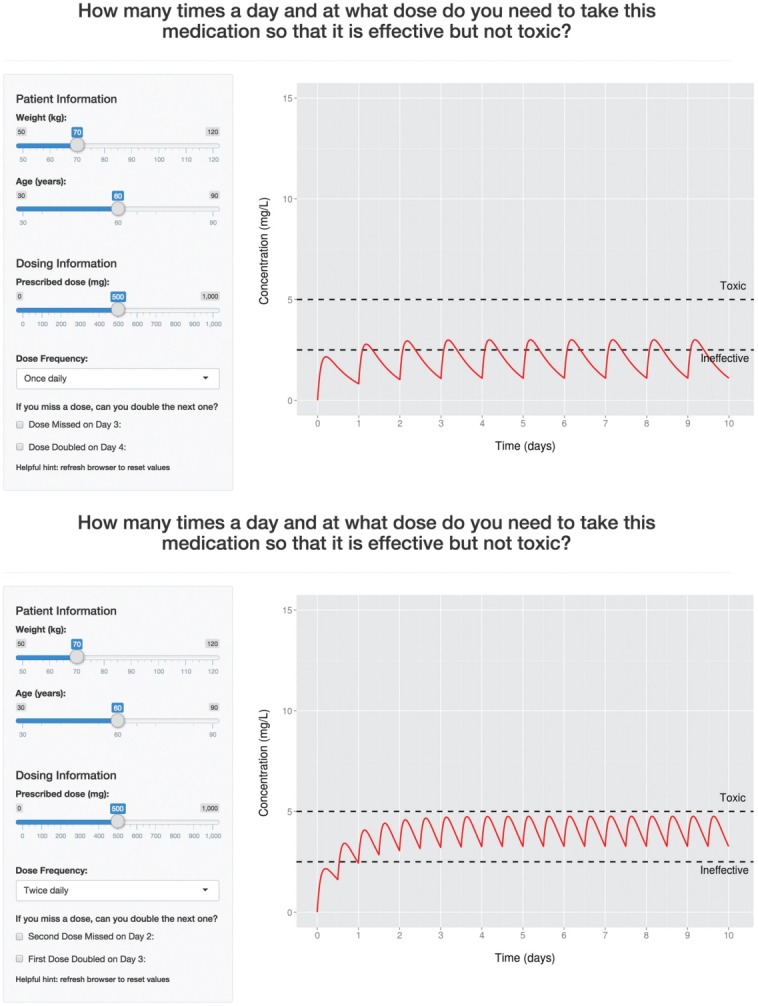
Preliminary patient education tool application. Shown are screenshots of the application featuring a one-compartment first-order absorption model running in a browser-window. The concentration–time profile is depicted as the solid red line, and black horizontal dashed lines represent the hypothetical therapeutic window (drug is ineffective at less than 2.5 mg/L, and toxic when greater than 5 mg/L). Top: Upon application initiation, the “Dose Frequency” selection box is pre-set to once daily and the output plot displays the concentration–time profile for the hypothetical drug over 10 d (10 doses) accordingly. Bottom: A scenario where the twice-daily dosing regimen is selected. The plot automatically updates to show the concentration–time profile when 20 doses are administered within the same 10-d period. The “missed dose” and “double dose” checkboxes also automatically update to describe specific doses in the twice-daily regimen.
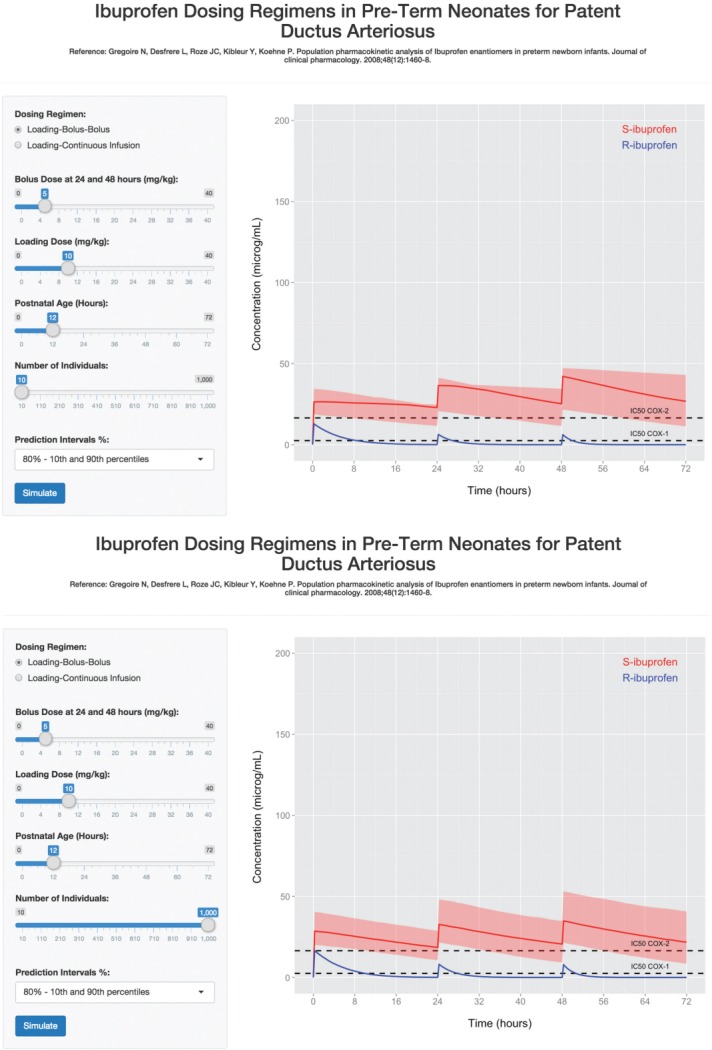
Ibuprofen in preterm neonates application. Shown are screenshots of the application featuring the population model by Gregoire et al. (2008) running in a browser-window. The blue solid line represents the simulated median concentrations for R-ibuprofen over the 72-h period, and the red solid line and the boundaries of the red shaded ribbons are the median, and the 10th and 90th percentiles for simulated S-ibuprofen concentrations, respectively. Black horizontal dashed lines represent the IC50 for COX-1 (2.5 μg/ml) and COX-2 (16.5 μ/ml) enzymes. Top: Upon application initiation, the number of individuals simulated is small (10) for rapid loading of all Web-page elements, and the IV loading-bolus-bolus regimen doses most commonly used in practice (10-5-5 mg/kg) is selected. Bottom: A scenario where 1,000 concentration–time profiles of the same regimen as above are simulated.
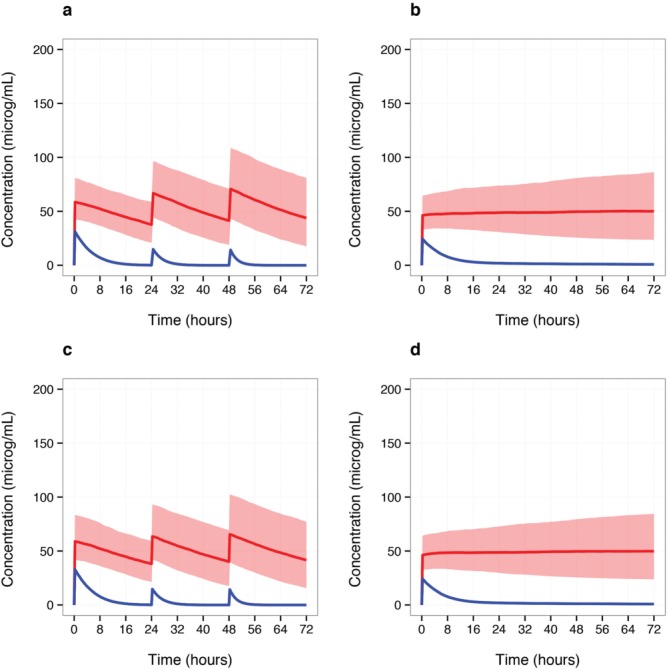
Comparison of Shiny and NONMEM® simulation outputs. Shown are the median concentrations at 15-min intervals for R- (blue solid line) and S-ibuprofen (red solid line), and the red shaded region represents the 10th and 90th percentiles for S-ibuprofen simulated concentrations, over a 72-h period. For each dosing regimen, a 1 kg patient with a post-natal age of 12 h was used to create a simulated population. (a,c) Concentration–time profiles based on the simulation of 1,000 individuals administered the IV loading-bolus-bolus dosing regimen (20-10-10 mg/kg). (b,d) Concentration–time profiles based on the simulation of 1,000 individuals administered the IV loading-continuous infusion regimen (16 mg/kg loading dose, 24 mg/kg continuously infusion over 72 h). (a,b) Shiny Application Example 3 output; code embedded in Shiny's server.R script was converted to a standard R-script to produce plots. (c,d) NONMEM® output; simulation output was processed and plotted using R.
References
-
- Bonate P. What happened to the modeling and simulation revolution? Clin. Pharmacol. Ther. 2014;96:416–417. - PubMed
-
- Wickham H. ggplot2: Elegant Graphics for Data Analysis. New York: Springer; 2009. . < http://had.co.nz/ggplot2/book >. ( )
LinkOut - more resources
Full Text Sources
Other Literature Sources
