. 2015 May;4(5):277-85.
doi: 10.1002/psp4.34. Epub 2015 Apr 24.

A Joint Model for the Kinetics of CTC Count and PSA Concentration During Treatment in Metastatic Castration-Resistant Prostate Cancer

Affiliations

A Joint Model for the Kinetics of CTC Count and PSA Concentration During Treatment in Metastatic Castration-Resistant Prostate Cancer

M Wilbaux et al. CPT Pharmacometrics Syst Pharmacol. 2015 May.

Abstract

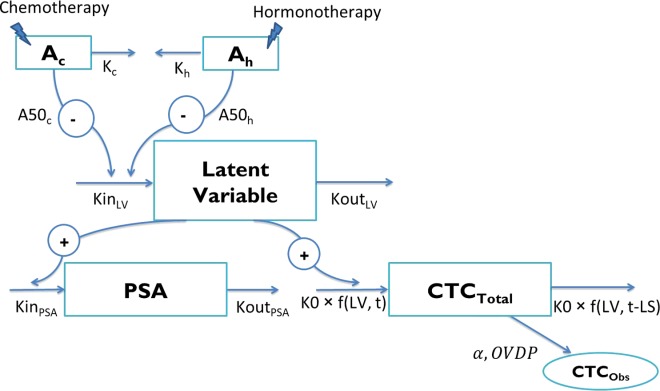
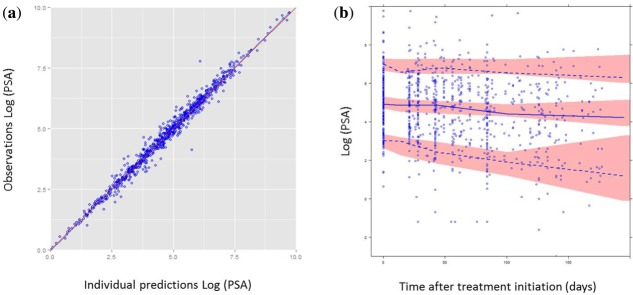
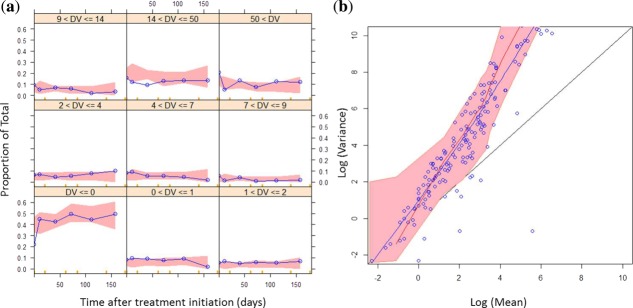
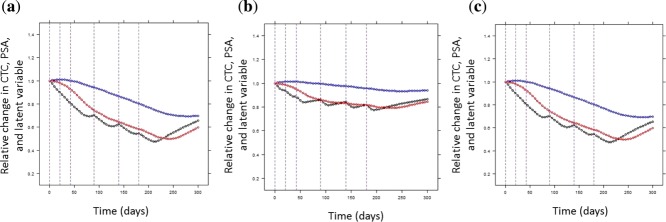
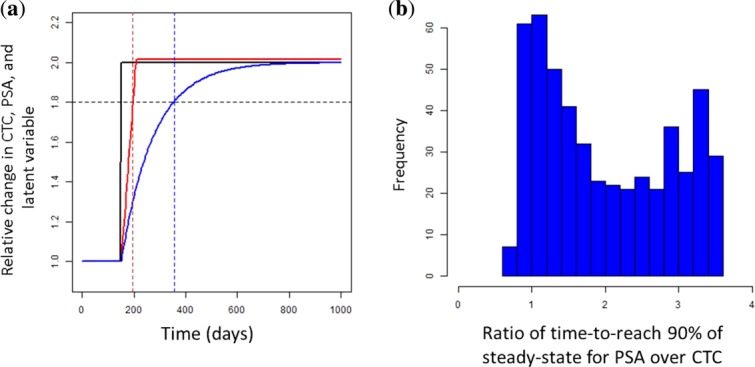
Assessment of treatment efficacy in metastatic castration-resistant prostate cancer (mCRPC) is limited by frequent nonmeasurable bone metastases. The count of circulating tumor cells (CTCs) is a promising surrogate marker that may replace the widely used prostate-specific antigen (PSA). The purpose of this study was to quantify the dynamic relationships between the longitudinal kinetics of these markers during treatment in patients with mCRPC. Data from 223 patients with mCRPC treated by chemotherapy and/or hormonotherapy were analyzed for up to 6 months of treatment. A semimechanistic model was built, combining the following several pharmacometric advanced features: (1) Kinetic-Pharmacodynamic (K-PD) compartments for treatments (chemotherapy and hormonotherapy); (2) a latent variable linking both marker kinetics; (3) modeling of CTC kinetics with a cell lifespan model; and (4) a negative binomial distribution for the CTC random sampling. Linked with survival, this model would potentially be useful for predicting treatment efficacy during drug development or for therapeutic adjustment in treated patients.


Figures

Figure 1
Figure 1
Structure of the model. Ac and Ah represent drug amounts in the chemotherapy and hormonotherapy compartments, respectively (arbitrary unit (AU)). Kc and Kh are the chemotherapy and hormonotherapy kinetic rate constants, respectively (day−1). A50c and A50h are the amounts of each treatment producing 50% of the maximum effect (AU), respectively. KinLV and KoutLV are the latent variable production and elimination rate constants (AU.day−1 and day−1), respectively. KinPSA and KoutPSA correspond to the prostate-specific antigen (PSA) production and elimination rate constants (ng.mL−1.day−1.AU−1 and day−1), respectively. K0 is the circulating tumor cells (CTC) production rate (CTC.day−1.AU−1). CTCTotal and CTCObs are the CTC counts in the total body blood and in the aliquot, respectively. α corresponds to the scaling factor and OVDP to the overdispersion parameter. LV, latent variable.
Figure 2
Figure 2
Evaluation of the model capacity to predict prostate-specific antigen (PSA). (a) Observed logarithms of PSA are plotted vs. individual transformed predictions. Red line is the identity line. (b) Visual predictive check (VPC): log-transformed PSA values are plotted vs. time. Red areas represent the 95% confidence intervals of the 5th, 95th, and 50th percentiles of simulated data. Blue dots are the observed values. Blue lines represent the median (solid line), and the 5th and 95th percentiles (dashed lines) of the observations.
Figure 3
Figure 3
Evaluation of the model capacity to predict circulating tumor cell (CTC) counts. (a) Categorical visual predictive checks (VPCs): the probability of having a number of CTCs for different CTC count categories was plotted vs. time. Red areas are the 95% confidence intervals of the simulated median probabilities. Blue lines are the observed probabilities. (b) Overdispersion plot: the logarithms of variance were plotted vs. the logarithms of mean. Black line is the identity line. Blue dots are the observations, and the blue line a lowess of the observations. Red line corresponds to the median of simulated data, and the red area to its 95% predicted interval.
Figure 4
Figure 4
Simulations under different treatment regimens. The circulating tumor cell (CTC), prostate-specific antigen (PSA), and the latent variables, all normalized by their baseline values, were plotted vs. time. Different typical patients were represented: (a) receiving chemotherapy alone, (b) hormonotherapy alone, or (c) both simultaneously. Blue curves represent the PSA kinetics, red curves the CTC kinetics, and black curves the latent variable kinetics. Vertical lines represent the treatment cycles.
Figure 5
Figure 5
(a) Simulations of prostate-specific antigen (PSA) and circulating tumor cell (CTC) kinetics under latent variable changes. CTCs, PSA, and the latent variables, all normalized by their baseline values, were plotted vs. time. Black curves represent the latent variable kinetics, red curves the CTC kinetics, and blue curves the PSA kinetics. Blue and red vertical dashed lines correspond to the time at which the PSA and CTC reached 90% of steady-state. Black horizontal dashed line is the 90% steady-states. (b) Distribution of the ratio of time-to-reach 90% of steady-state for PSA over CTC, in a simulated population of 500 patients.

References

    1. Jemal A, Bray F, Center MM, Ferlay J, Ward E. Forman D. Global cancer statistics. CA Cancer J. Clin. 2011;61:69–90. - PubMed
    1. Bubendorf L, et al. Metastatic patterns of prostate cancer: an autopsy study of 1,589 patients. Hum. Pathol. 2000;31:578–583. - PubMed
    1. Scher HI, et al. Design and end points of clinical trials for patients with progressive prostate cancer and castrate levels of testosterone: recommendations of the Prostate Cancer Clinical Trials Working Group. J. Clin. Oncol. 2008;26:1148–1159. - PMC - PubMed
    1. Wang MC, Valenzuela LA, Murphy GP. Chu TM. Purification of a human prostate specific antigen. Invest. Urol. 1979;17:159–163. - PubMed
    1. Almufti R, et al. A critical review of the analytical approaches for circulating tumor biomarker kinetics during treatment. Ann. Oncol. 2014;25:41–56. - PubMed