

Differences in Early Stages of Tactile ERP Temporal Sequence (P100) in Cortical Organization during Passive Tactile Stimulation in Children with Blindness and Controls
- PMID: 26225827
- PMCID: PMC4520520
- DOI: 10.1371/journal.pone.0124527
Differences in Early Stages of Tactile ERP Temporal Sequence (P100) in Cortical Organization during Passive Tactile Stimulation in Children with Blindness and Controls
Abstract
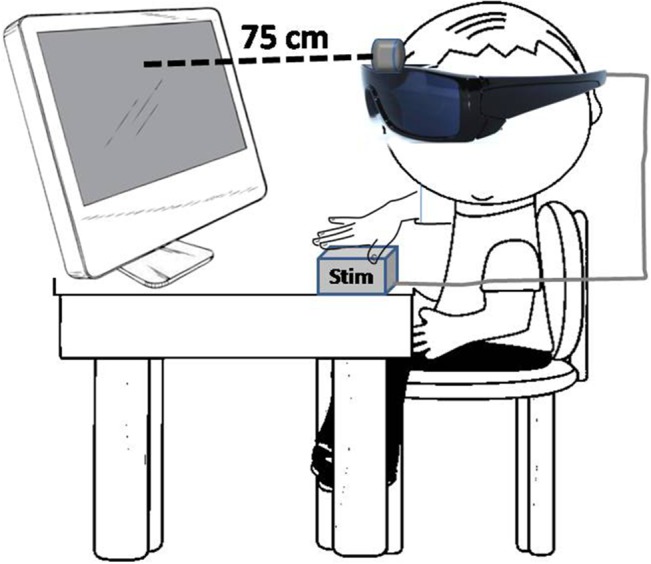
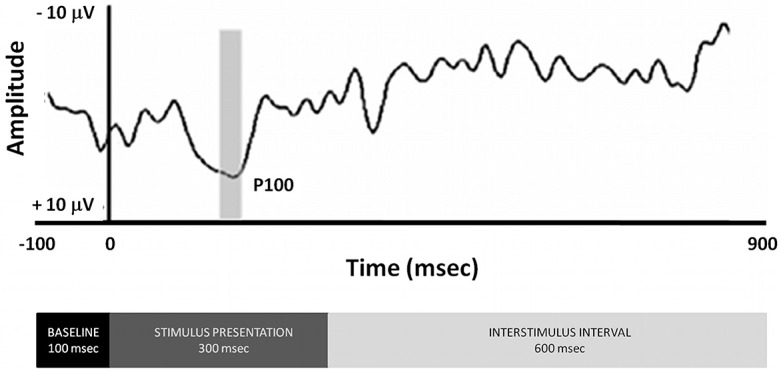
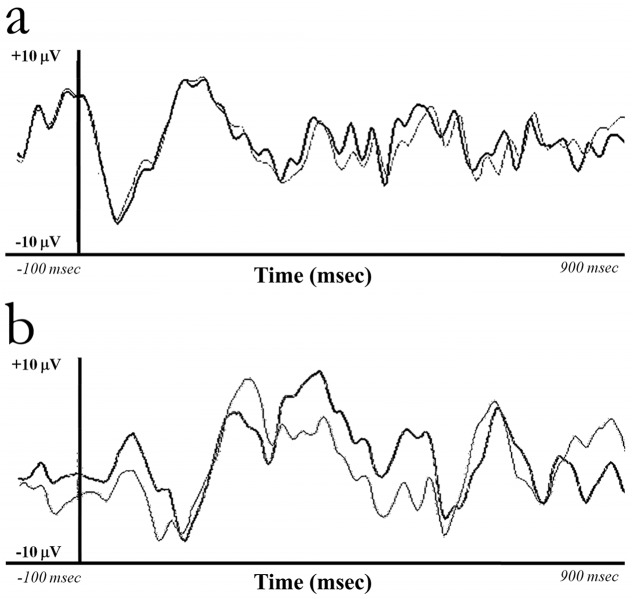
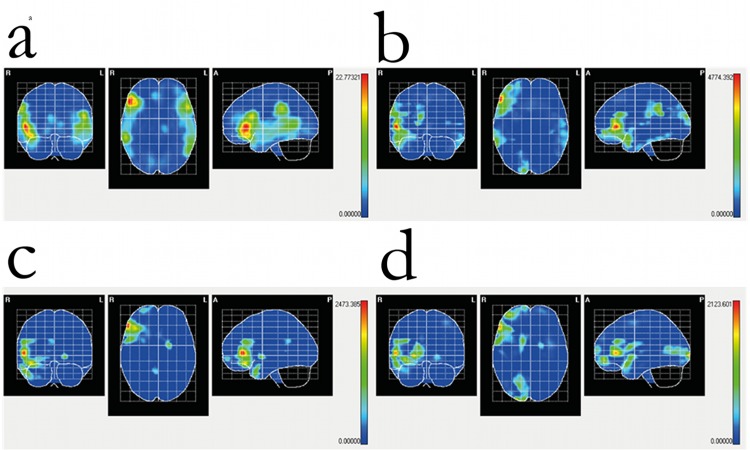
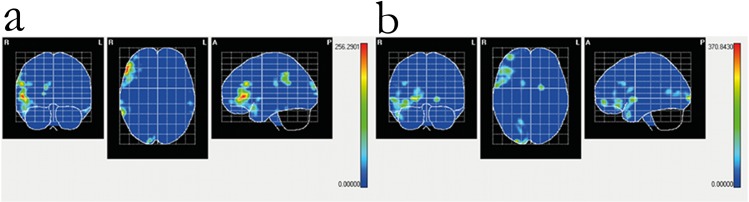
Compared to their seeing counterparts, people with blindness have a greater tactile capacity. Differences in the physiology of object recognition between people with blindness and seeing people have been well documented, but not when tactile stimuli require semantic processing. We used a passive vibrotactile device to focus on the differences in spatial brain processing evaluated with event related potentials (ERP) in children with blindness (n = 12) vs. normally seeing children (n = 12), when learning a simple spatial task (lines with different orientations) or a task involving recognition of letters, to describe the early stages of its temporal sequence (from 80 to 220 msec) and to search for evidence of multi-modal cortical organization. We analysed the P100 of the ERP. Children with blindness showed earlier latencies for cognitive (perceptual) event related potentials, shorter reaction times, and (paradoxically) worse ability to identify the spatial direction of the stimulus. On the other hand, they are equally proficient in recognizing stimuli with semantic content (letters). The last observation is consistent with the role of P100 on somatosensory-based recognition of complex forms. The cortical differences between seeing control and blind groups, during spatial tactile discrimination, are associated with activation in visual pathway (occipital) and task-related association (temporal and frontal) areas. The present results show that early processing of tactile stimulation conveying cross modal information differs in children with blindness or with normal vision.
Conflict of interest statement
Figures
References
-
- Allison T, McCarthy G, Wood CC. The relationship between human long-latency somatosensory evoked potentials recorded from the cortical surface and from the scalp. Electroencephalogr Clin Neurophysiol. 1992. August;84(4):301–14. - PubMed
-
- Amedi A, Jacobson G, Hendler T, Malach R, Zohary E. Convergence of visual and tactile shape processing in the human lateral occipital complex. Cereb Cortex. 2002. November;12(11):1202–12. - PubMed
-
- Cohen LG, Weeks RA, Sadato N, Celnik P, Ishii K, Hallett M. Period of susceptibility for cross-modal plasticity in the blind. Ann Neurol. 1999. April;45(4):451–60. - PubMed
-
- Ponton CW, Don M, Eggermont JJ, Waring MD, Kwong B, Masuda A. Auditory system plasticity in children after long periods of complete deafness. Neuroreport. 1996. December 20;8(1):61–5. - PubMed
Publication types
MeSH terms
Grants and funding
LinkOut - more resources
Full Text Sources
Other Literature Sources
