

Contribution of Topological Domains and Loop Formation to 3D Chromatin Organization
- PMID: 26226004
- PMCID: PMC4584327
- DOI: 10.3390/genes6030734
Contribution of Topological Domains and Loop Formation to 3D Chromatin Organization
Abstract
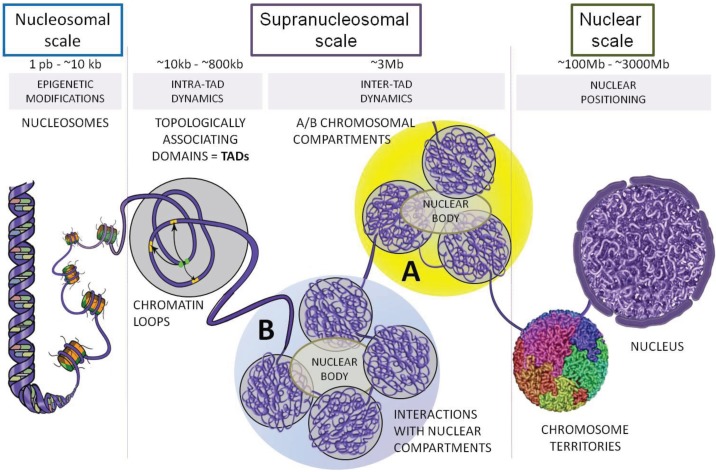
Recent investigations on 3D chromatin folding revealed that the eukaryote genomes are both highly compartmentalized and extremely dynamic. This review presents the most recent advances in topological domains' organization of the eukaryote genomes and discusses the relationship to chromatin loop formation. CTCF protein appears as a central factor of these two organization levels having either a strong insulating role at TAD borders, or a weaker architectural role in chromatin loop formation. TAD borders directly impact on chromatin dynamics by restricting contacts within specific genomic portions thus confining chromatin loop formation within TADs. We discuss how sub-TAD chromatin dynamics, constrained into a recently described statistical helix conformation, can produce functional interactions by contact stabilization.
Keywords: CTCF; TAD borders; chromatin dynamics; chromatin loops; statistical helix; topological domains.
Figures
Similar articles
-
Recent evidence that TADs and chromatin loops are dynamic structures.Nucleus. 2018 Jan 1;9(1):20-32. doi: 10.1080/19491034.2017.1389365. Epub 2017 Dec 14. Nucleus. 2018. PMID: 29077530 Free PMC article. Review.
-
Evolutionary comparison reveals that diverging CTCF sites are signatures of ancestral topological associating domains borders.Proc Natl Acad Sci U S A. 2015 Jun 16;112(24):7542-7. doi: 10.1073/pnas.1505463112. Epub 2015 Jun 1. Proc Natl Acad Sci U S A. 2015. PMID: 26034287 Free PMC article.
-
TADs and Their Borders: Free Movement or Building a Wall?J Mol Biol. 2020 Feb 7;432(3):643-652. doi: 10.1016/j.jmb.2019.11.025. Epub 2019 Dec 27. J Mol Biol. 2020. PMID: 31887284 Review.
-
Distinct polymer physics principles govern chromatin dynamics in mouse and Drosophila topological domains.BMC Genomics. 2015 Aug 15;16(1):607. doi: 10.1186/s12864-015-1786-8. BMC Genomics. 2015. PMID: 26271925 Free PMC article.
-
Chromatin Insulators and Topological Domains: Adding New Dimensions to 3D Genome Architecture.Genes (Basel). 2015 Sep 1;6(3):790-811. doi: 10.3390/genes6030790. Genes (Basel). 2015. PMID: 26340639 Free PMC article. Review.
Cited by
-
Identifying clusters of cis-regulatory elements underpinning TAD structures and lineage-specific regulatory networks.Genome Res. 2019 Oct;29(10):1733-1743. doi: 10.1101/gr.248658.119. Epub 2019 Sep 18. Genome Res. 2019. PMID: 31533978 Free PMC article.
-
Contribution of 3D genome topological domains to genetic risk of cancers: a genome-wide computational study.Hum Genomics. 2022 Jan 11;16(1):2. doi: 10.1186/s40246-022-00375-2. Hum Genomics. 2022. PMID: 35016721 Free PMC article.
-
Alterations in promoter interaction landscape and transcriptional network underlying metabolic adaptation to diet.Nat Commun. 2020 Feb 19;11(1):962. doi: 10.1038/s41467-020-14796-x. Nat Commun. 2020. PMID: 32075973 Free PMC article.
-
Association between Triplex-Forming Sites of Cardiac Long Noncoding RNA GATA6-AS1 and Chromatin Organization.Noncoding RNA. 2022 Jun 1;8(3):41. doi: 10.3390/ncrna8030041. Noncoding RNA. 2022. PMID: 35736638 Free PMC article.
-
Profound alterations of the chromatin architecture at chromosome 11p15.5 in cells from Beckwith-Wiedemann and Silver-Russell syndromes patients.Sci Rep. 2020 May 19;10(1):8275. doi: 10.1038/s41598-020-65082-1. Sci Rep. 2020. PMID: 32427849 Free PMC article.
References
-
- Lieberman-Aiden E., van Berkum N.L., Williams L., Imakaev M., Ragoczy T., Telling A., Amit I., Lajoie B.R., Sabo P.J., Dorschner M.O., et al. Comprehensive mapping of long-range interactions reveals folding principles of the human genome. Science. 2009;326:289–293. doi: 10.1126/science.1181369. - DOI - PMC - PubMed
-
- Rao S.S., Huntley M.H., Durand N.C., Stamenova E.K., Bochkov I.D., Robinson J.T., Sanborn A.L., Machol I., Omer A.D., Lander E.S., et al. A 3D map of the human genome at kilobase resolution reveals principles of chromatin looping. Cell. 2014;159:1665–1680. doi: 10.1016/j.cell.2014.11.021. - DOI - PMC - PubMed
Publication types
LinkOut - more resources
Full Text Sources
Other Literature Sources
