. 2015 Jul 30;11(7):e1004383.
doi: 10.1371/journal.pcbi.1004383. eCollection 2015 Jul.

Forecasting Influenza Epidemics in Hong Kong

Affiliations

Forecasting Influenza Epidemics in Hong Kong

Wan Yang et al. PLoS Comput Biol. .

Abstract

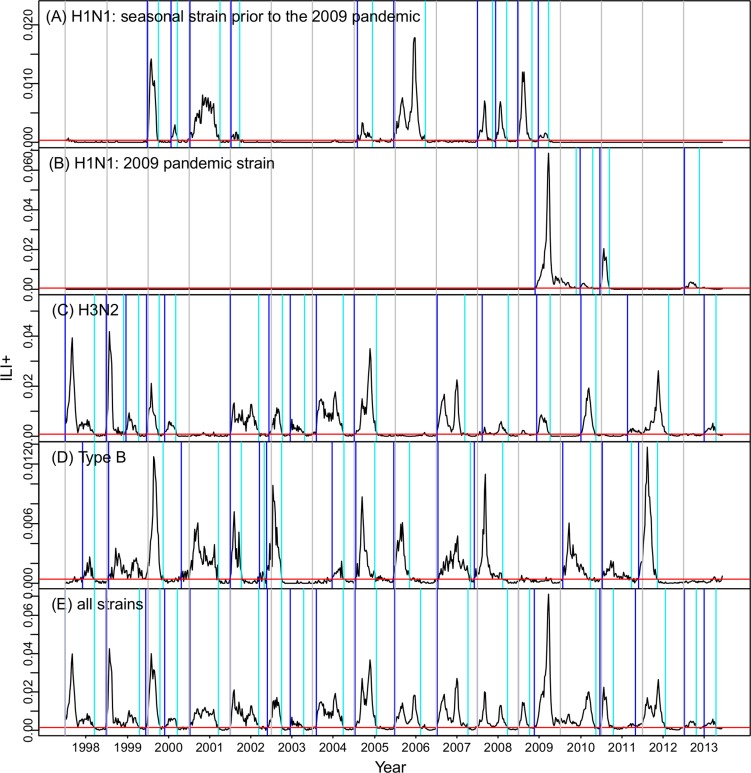
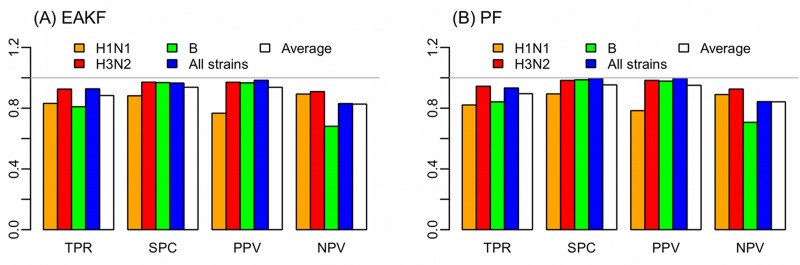
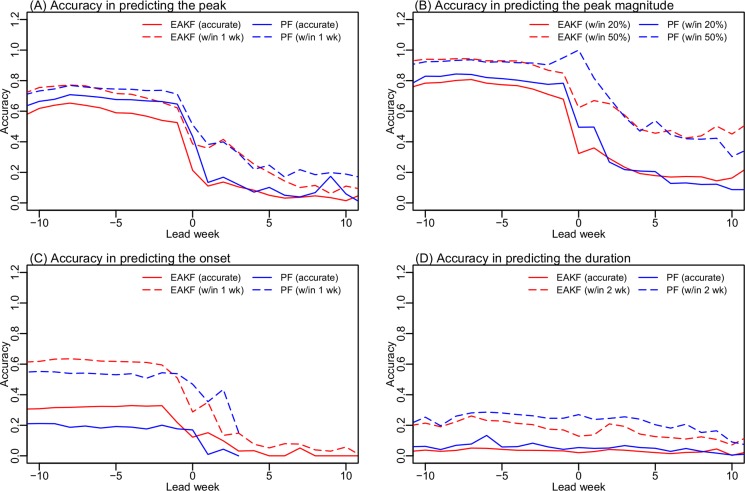
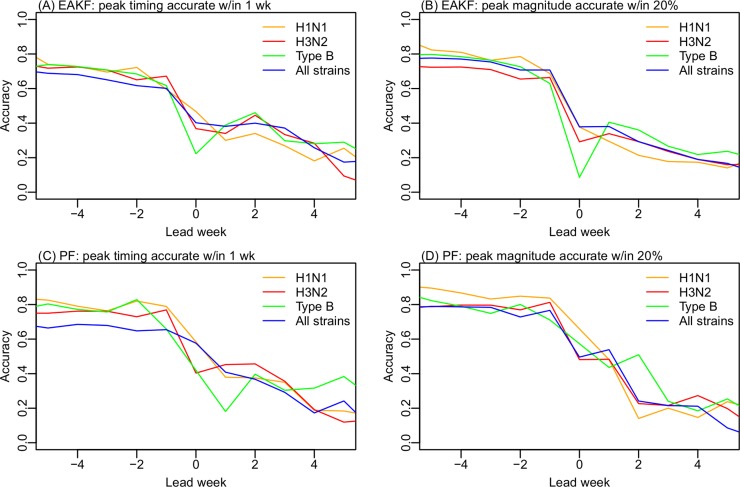
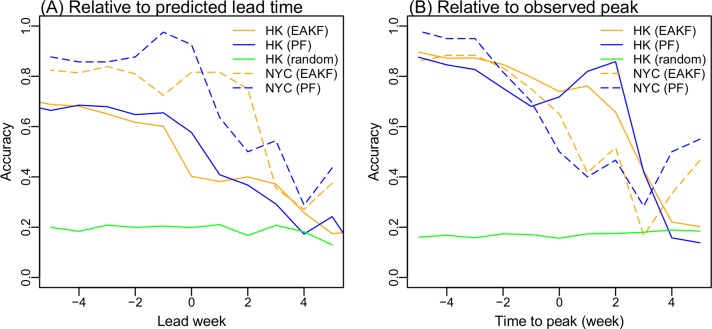
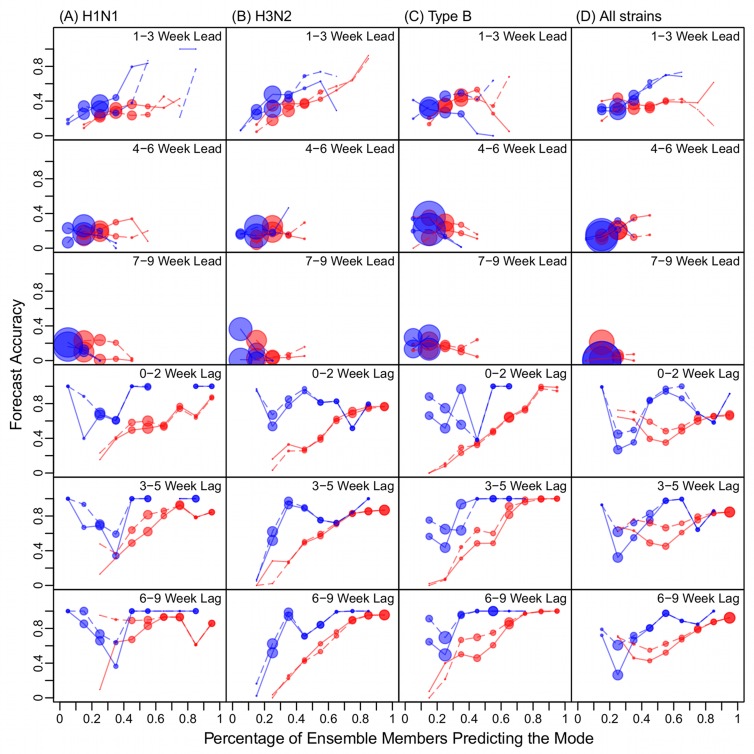
Recent advances in mathematical modeling and inference methodologies have enabled development of systems capable of forecasting seasonal influenza epidemics in temperate regions in real-time. However, in subtropical and tropical regions, influenza epidemics can occur throughout the year, making routine forecast of influenza more challenging. Here we develop and report forecast systems that are able to predict irregular non-seasonal influenza epidemics, using either the ensemble adjustment Kalman filter or a modified particle filter in conjunction with a susceptible-infected-recovered (SIR) model. We applied these model-filter systems to retrospectively forecast influenza epidemics in Hong Kong from January 1998 to December 2013, including the 2009 pandemic. The forecast systems were able to forecast both the peak timing and peak magnitude for 44 epidemics in 16 years caused by individual influenza strains (i.e., seasonal influenza A(H1N1), pandemic A(H1N1), A(H3N2), and B), as well as 19 aggregate epidemics caused by one or more of these influenza strains. Average forecast accuracies were 37% (for both peak timing and magnitude) at 1-3 week leads, and 51% (peak timing) and 50% (peak magnitude) at 0 lead. Forecast accuracy increased as the spread of a given forecast ensemble decreased; the forecast accuracy for peak timing (peak magnitude) increased up to 43% (45%) for H1N1, 93% (89%) for H3N2, and 53% (68%) for influenza B at 1-3 week leads. These findings suggest that accurate forecasts can be made at least 3 weeks in advance for subtropical and tropical regions.


Conflict of interest statement

I have read the journal's policy and the authors of this manuscript have the following competing interests: BJC has received research funding from MedImmune Inc. and Sanofi Pasteur, and consults for Crucell NV. JS discloses consulting for JWT and Axon Advisors, as well as partial ownership of SK Analytics. The authors report no other potential conflicts of interest. This does not alter our adherence to all PLOS policies on sharing data and materials.

Figures

Fig 1
Fig 1. Time series of ILI+ for each strain: (A) seasonal A(H1N1), (B) pandemic A(H1N1), (C) A(H3N2), (D) Influenza B, and (E) all strains.
Black lines are ILI+ observations; red horizontal lines are baselines; blue vertical lines are the identified onsets; cyan vertical lines are identified endings; grey vertical lines are year divisions.
Fig 2
Fig 2. Accuracy predicting gross epidemic activity.
Four measures, sensitivity (i.e., true positive rate, TPR), specificity (i.e., true negative rate, SPC), precision (i.e., positive predictive value, PPV), and negative predictive value (NPV) are shown for (A) the SIR-EAKF and (B) the SIR-PF forecast system. Results are tallied over forecast of H1N1 (orange), H3N2 (red), Type B (green), all strains combined time series (blue), and all forecasts (white).
Fig 3
Fig 3. Accuracy predicting outbreak peak timing (A), peak magnitude (B), onset (C), and duration (D).
Accuracy was calculated over all forecasts (332,400 for each setting of the forecast system). This analysis includes the forecasts for seasonal H1N1, the 2009 pandemic H1N1, H3N2, B and all strains combined. Results are shown for the EAKF (red) and the PF (blue), evaluated using two standards (solid vs. dashed lines, as specified in the parentheses). On the x-axis, positive leads indicate that a peak is forecast in the future; negative leads indicate that a peak is forecast in the past; a 0 week lead indicates that a peak is forecast as the same week of forecast. Leads are relative to the predicted peak for forecasts of the peak timing, peak magnitude, and duration, and relative to the predicted onset for forecasts of onset timing.
Fig 4
Fig 4. Performance of the SIR-EAKF (A and B) and the SIR-PF (C and D) for individual strains predictions of peak timing (A and C) and magnitude (B and D).
Fig 5
Fig 5. Comparison of forecast accuracy for Hong Kong (HK) and New York City (NYC) using the EAKF and PF filters, as well as random sampling from historical records for HK.
Forecast accuracy was evaluated by grouping predictions based on (A) predicted lead time (i.e. how far in the future the peak is predicted) or (B) actual forecast week relative to the observed peak. Positive leads indicate that a peak is forecast in the future; negative leads indicate that a peak is forecast in the past; a 0 week lead indicates that a peak is forecast for the week of forecast initiation.
Fig 6
Fig 6. Forecast accuracy versus ensemble spread.
The ensemble spread is presented as the percentage of ensemble members predicting the mode peak week (PEMPM). Red lines are generated using the EAKF and blue lines using the PF; solid lines show forecast accuracies for peak timing (within ±1 week of observation); dashed lines show forecast accuracies for peak magnitude (within ±20% of observation). The filled circle size associated with each PEMPM bin represents the fraction of forecasts within each lead category.

References

    1. Shaman J, Karspeck A, Yang W, Tamerius J, Lipsitch M (2013) Real-time influenza forecasts during the 2012–2013 season. Nat Commun 4: 2837 10.1038/ncomms3837 - DOI - PMC - PubMed
    1. Chretien JP, George D, Shaman J, Chitale RA, McKenzie FE (2014) Influenza forecasting in human populations: a scoping review. Plos One 9: e94130 10.1371/journal.pone.0094130 - DOI - PMC - PubMed
    1. Nsoesie EO, Brownstein JS, Ramakrishnan N, Marathe MV (2013) A systematic review of studies on forecasting the dynamics of influenza outbreaks. Influenza Other Respir Viruses 10.1111/irv.12226 - DOI - PMC - PubMed
    1. Columbia Prediction of Infectious Diseases: Influenza forecasts. http://cpid.iri.columbia.edu
    1. Network Dynamics and Simulation Science Laboratory Flucaster. http://socialeyes.vbi.vt.edu/flucaster/flucaster.html

Publication types