

A Social Network Approach Reveals Associations between Mouse Social Dominance and Brain Gene Expression
- PMID: 26226265
- PMCID: PMC4520683
- DOI: 10.1371/journal.pone.0134509
A Social Network Approach Reveals Associations between Mouse Social Dominance and Brain Gene Expression
Abstract
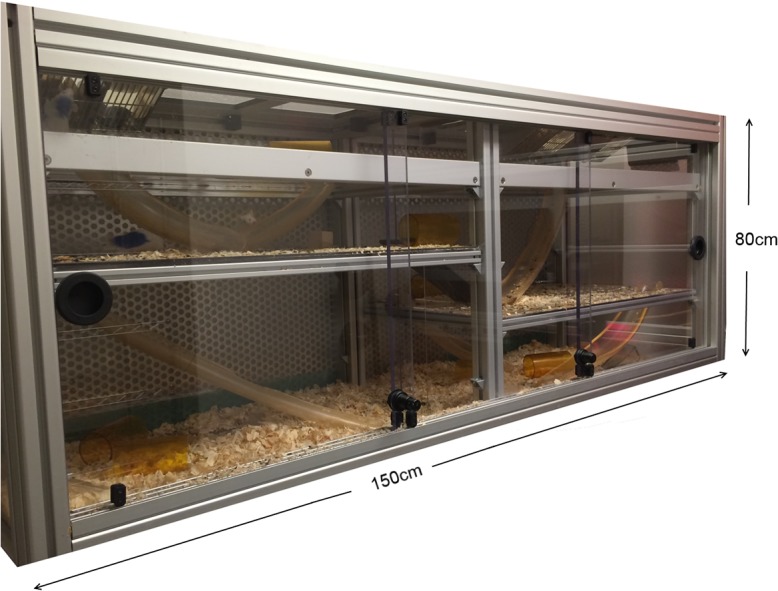
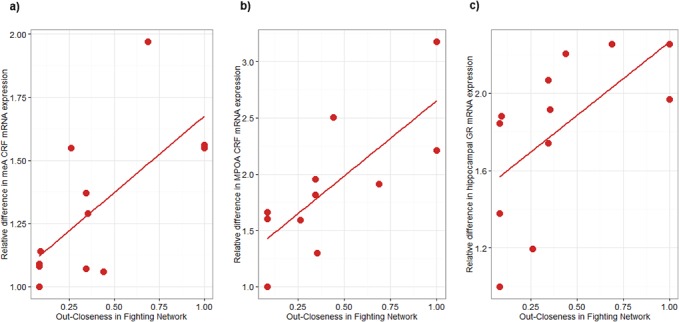
Modelling complex social behavior in the laboratory is challenging and requires analyses of dyadic interactions occurring over time in a physically and socially complex environment. In the current study, we approached the analyses of complex social interactions in group-housed male CD1 mice living in a large vivarium. Intensive observations of social interactions during a 3-week period indicated that male mice form a highly linear and steep dominance hierarchy that is maintained by fighting and chasing behaviors. Individual animals were classified as dominant, sub-dominant or subordinate according to their David's Scores and I& SI ranking. Using a novel dynamic temporal Glicko rating method, we ascertained that the dominance hierarchy was stable across time. Using social network analyses, we characterized the behavior of individuals within 66 unique relationships in the social group. We identified two individual network metrics, Kleinberg's Hub Centrality and Bonacich's Power Centrality, as accurate predictors of individual dominance and power. Comparing across behaviors, we establish that agonistic, grooming and sniffing social networks possess their own distinctive characteristics in terms of density, average path length, reciprocity out-degree centralization and out-closeness centralization. Though grooming ties between individuals were largely independent of other social networks, sniffing relationships were highly predictive of the directionality of agonistic relationships. Individual variation in dominance status was associated with brain gene expression, with more dominant individuals having higher levels of corticotropin releasing factor mRNA in the medial and central nuclei of the amygdala and the medial preoptic area of the hypothalamus, as well as higher levels of hippocampal glucocorticoid receptor and brain-derived neurotrophic factor mRNA. This study demonstrates the potential and significance of combining complex social housing and intensive behavioral characterization of group-living animals with the utilization of novel statistical methods to further our understanding of the neurobiological basis of social behavior at the individual, relationship and group levels.
Conflict of interest statement
Figures
Similar articles
-
Dynamic changes in social dominance and mPOA GnRH expression in male mice following social opportunity.Horm Behav. 2017 Jan;87:80-88. doi: 10.1016/j.yhbeh.2016.11.001. Epub 2016 Nov 5. Horm Behav. 2017. PMID: 27826060
-
Social context-dependent relationships between mouse dominance rank and plasma hormone levels.Physiol Behav. 2017 Mar 15;171:110-119. doi: 10.1016/j.physbeh.2016.12.038. Epub 2017 Jan 6. Physiol Behav. 2017. PMID: 28065723
-
Sociometrics of Macaca mulatta: II. Decoupling centrality and dominance in rhesus monkey social networks.Am J Phys Anthropol. 1988 Dec;77(4):409-25. doi: 10.1002/ajpa.1330770403. Am J Phys Anthropol. 1988. PMID: 3223514
-
Affiliative relationships and reciprocity among adult male bonnet macaques (Macaca radiata) at Arunachala Hill, India.Am J Primatol. 2011 Nov;73(11):1107-13. doi: 10.1002/ajp.20987. Epub 2011 Sep 8. Am J Primatol. 2011. PMID: 21905059 Review.
-
[Social dominance and rank relationships in domestic pigs: a critical review].Berl Munch Tierarztl Wochenschr. 1996 Nov-Dec;109(11-12):457-64. Berl Munch Tierarztl Wochenschr. 1996. PMID: 8999780 Review. German.
Cited by
-
Krüppel-homologue 1 Mediates Hormonally Regulated Dominance Rank in a Social Bee.Biology (Basel). 2021 Nov 15;10(11):1188. doi: 10.3390/biology10111188. Biology (Basel). 2021. PMID: 34827180 Free PMC article.
-
Neural Circuits Underlying Rodent Sociality: A Comparative Approach.Curr Top Behav Neurosci. 2019;43:211-238. doi: 10.1007/7854_2018_77. Curr Top Behav Neurosci. 2019. PMID: 30710222 Free PMC article.
-
Association between social dominance hierarchy and PACAP expression in the extended amygdala, corticosterone, and behavior in C57BL/6 male mice.Sci Rep. 2024 Apr 18;14(1):8919. doi: 10.1038/s41598-024-59459-9. Sci Rep. 2024. PMID: 38637645 Free PMC article.
-
A systematic review and meta-analysis of how social memory is studied.Sci Rep. 2024 Jan 26;14(1):2221. doi: 10.1038/s41598-024-52277-z. Sci Rep. 2024. PMID: 38278973 Free PMC article.
-
Reestablishment of Social Hierarchies in Weaned Pigs after Mixing.Animals (Basel). 2019 Dec 23;10(1):36. doi: 10.3390/ani10010036. Animals (Basel). 2019. PMID: 31878050 Free PMC article.
References
-
- Kas MJ, Glennon JC, Buitelaar J, Ey E, Biemans B, Crawley J, et al. (2014) Assessing behavioural and cognitive domains of autism spectrum disorders in rodents: current status and future perspectives. Psychopharmacology (Berl) 231: 1125–1146. - PubMed
-
- Brodkin ES (2007) BALB/c mice: low sociability and other phenotypes that may be relevant to autism. Behav Brain Res 176: 53–65. - PubMed
-
- Frazer KA, Eskin E, Kang HM, Bogue MA, Hinds DA, Beilharz EJ, et al. (2007) A sequence-based variation map of 8.27 million SNPs in inbred mouse strains. Nature 448: 1050–1053. - PubMed
-
- Berry RJ (1970) The Natural History of the House Mouse. Field Studies 3: 219–262.
-
- Crowcroft P (1955) Territorality in wild house mice, Mus musculus L. J Mammal: 299–301.
Publication types
MeSH terms
LinkOut - more resources
Full Text Sources
Other Literature Sources
