. 2015 Oct:484:386-394.
doi: 10.1016/j.virol.2015.06.018. Epub 2015 Jul 28.

Viral gene expression potentiates reovirus-induced necrosis

Affiliations

Viral gene expression potentiates reovirus-induced necrosis

Bradley E Hiller et al. Virology. 2015 Oct.

Abstract

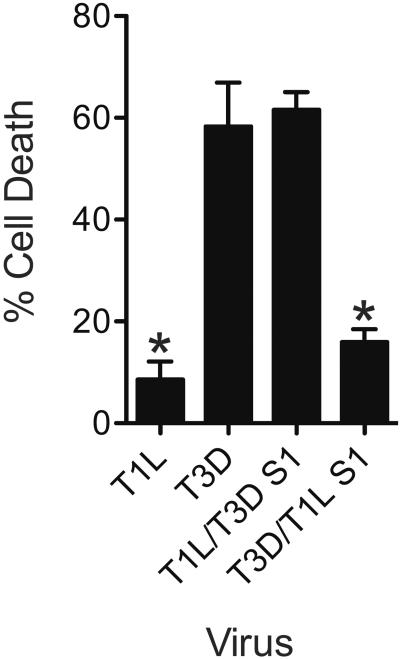
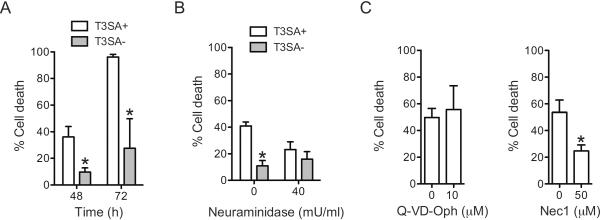
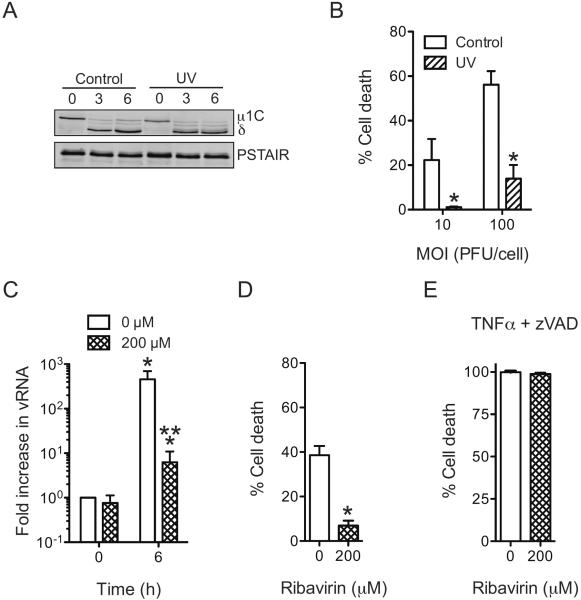
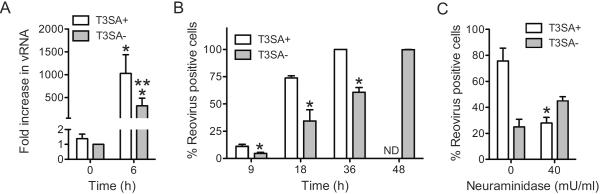
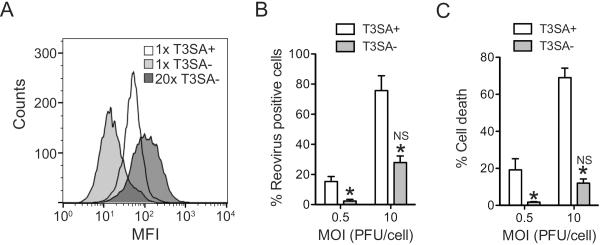
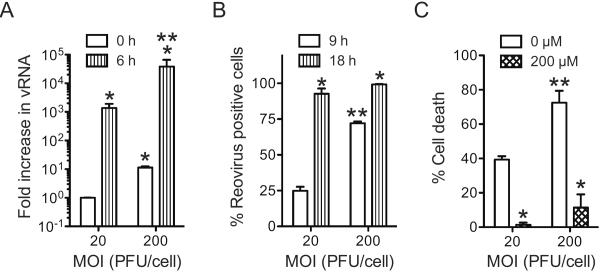
Infection of some cell types by reovirus evokes a caspase-independent form of cell death resembling necrosis. While reovirus strain T3D induces necrosis much more efficiently than strain T1L, which viral components contribute to this difference is not known. In this study, we identified that the sialic acid binding property of the reovirus σ1 protein affects necrosis efficiency. We found that in addition to sialic acid engagement by the virus particles, viral gene expression, in the form of viral RNA or protein synthesis, is also required for necrosis induction. Our studies reveal that sialic acid does not directly participate in necrosis induction by initiating a signaling pathway. Instead, sialic acid engagement augments necrosis induction indirectly, by increasing reovirus gene expression in each infected cell. Comparison of our results with previous studies suggests that reovirus-induced apoptosis and necrosis are initiated by distinct stages of viral infection.

Keywords: Cell death; Necrosis; Reovirus.


Figures

Fig. 1
Fig. 1. The S1 gene determines efficiency with which reovirus induces necrosis
ATCC L929 cells were adsorbed with 10 PFU/cell of T1L, T3D, T1L/T3DS1, or T3D/T1LS1. Following incubation at 37°C for 48 h, cells were stained with AOEB. The results are expressed as the mean percentages of cells undergoing cell death for three independent experiments. Error bars indicate SD. *, P < 0.05 by student's t test in comparison to T3D.
Fig. 2
Fig. 2. Sialic acid engagement is required for efficient induction of necrosis by reovirus
(A) ATCC L929 cells were adsorbed with 10 PFU/cell of T3SA+ or T3SA−. Following incubation at 37°C for 48 and 72 h, cells were stained with AOEB. The results are expressed as the mean percentages of cells undergoing cell death for three independent experiments. Error bars indicate SD. *, P < 0.05 by student's t test in comparison to T3SA+ at the comparable time point. (B) ATCC L929 cells were pretreated with PBS or 40mU/mL neuraminidase for 1 h at 37°C, washed with PBS and adsorbed with 10 PFU/cell of T3SA+ or T3SA−. Following incubation at 37°C for 48 h, cells were stained with AOEB. The results are expressed as the mean percentages of cells undergoing cell death for three independent experiments. Error bars indicate SD. *, P < 0.05 by student's t test in comparison to T3SA+ without neuraminidase. (C) ATCC L929 cells were adsorbed with 10 PFU/cell of T3SA+. Following incubation at 37°C for 48 in the presence of DMSO (0 μM) or the indicated concentration of Q-VD-OPh or Nec1 the, the cells were stained with AOEB. The results are expressed as the mean percentages of cells undergoing cell death for three independent experiments. Error bars indicate SD. *, P < 0.05 by student's t test in comparison to T3SA+ in the presence of DMSO.
Fig. 3
Fig. 3. Events subsequent to sialic acid engagement are required for reovirus-induced necrosis
(A) ATCC L929 cells were absorbed with untreated or UV inactivated T3SA+ at an MOI of 100 PFU/cell. Cell lysates prepared following infection in the presence of CHX for various time intervals were immunoblotted for μ1 and PSTAIR loading control. μ1 resolves as μ1C on SDS-PAGE gels (Nibert et al., 2005). (B) ATCC L929 cells were adsorbed with 10 PFU/cell or 100 PFU/cell of T3SA+ or UV-treated T3SA+. Following incubation at 37°C for 24 h, cells were stained with AOEB. The results are expressed as the mean percentages of cells undergoing cell death for three independent experiments. Error bars indicate SD. *, P < 0.05 by student's t test in comparison to an equivalent MOI of untreated T3SA+. (C) ATCC L929 cells were pretreated with 0 or 200 μM ribavirin for 1 h at 37°C, then washed and adsorbed with 10 PFU/cell of T3SA+. Increase in viral RNA levels were determined following incubation with 0 or 200 μM ribavirin at 37°C for 6 h. The results are expressed as mean increase in RNA for three independent samples. Errors indicate SD. * P < 0.05 by student's t test in comparison to cell treated with 0 μM ribavirin at 0 h. (D) ATCC L929 cells were pretreated with 0 or 200 μM ribavirin for 1 h at 37°C, then washed and adsorbed with 10 PFU/cell of T3SA+. Following incubation at 37°C for 48 h in the presence of 0 or 200 μM ribavirin, cells were stained with AOEB. The results are expressed as the mean percentages of cells undergoing cell death for three independent experiments. Error bars indicate SD. *, P < 0.05 by student's t test in comparison to T3SA+ in the presence of 0 μM ribavirin. (E) ATCC L929 cells were pretreated with 0 or 200 μM ribavirin for 1 h at 37°C, then treated with 10 ng/ml TNFα and 25 μM Z-VAD-FMK for 12 h. The results are expressed as the mean percentages of cells undergoing cell death for three independent experiments. Error bars indicate SD.
Fig. 4
Fig. 4. Sialic acid attachment enhances efficiency of viral gene expression
(A) ATCC L929 cells were adsorbed with 10 PFU/cell of T3SA+ or T3SA−. Increase in viral RNA levels was determined following incubation at 37°C for 6 h. The results are expressed as mean increase in RNA for three independent samples. Errors indicate SD. * P < 0.05 by student's t test in comparison to T3SA− at 0 h. ** P < 0.05 by student's t test in comparison to T3SA− at 6 h. (B) ATCC L929 cells were infected with T3SA+ or T3SA− at 10 PFU/cell. The results are expressed as the mean percentages of reovirus positive cells for three independent experiments. Error bars indicate SD. *, P < 0.05 by student's t test in comparison to T3SA+ at the comparable time point. ND, not determined (C) ATCC L929 cells pretreated with PBS or 40mU/mL neuraminidase at 37°C for 1 h, then washed and adsorbed with T3SA+ or T3SA− at 10 PFU/cell. Following incubation at 37°C for 18 h, reovirus positive cells were identified by indirect immunofluorescence. The results are expressed as the mean percentages of reovirus positive cells for three independent experiments. Error bars indicate SD. *, P < 0.05 by student's t test in comparison to T3SA+ in absence of neuraminidase.
Fig. 5
Fig. 5. T3SA− can overcome low cell death potential at higher doses
(A) ATCC L929 cells were adsorbed with 6 × 10⁴ (1×) or 1.2 × 10⁵ (20×) particles/cell of T3SA+ or T3SA−. Attached virions were detected by staining with anti-reovirus sera using a flow cytometer. (B) ATCC L929 cells were adsorbed with T3SA+ or T3SA− at the indicated MOI. Following incubation at 37°C for 18 h, reovirus positive cells were identified by indirect immunofluorescence. The results are expressed as the mean percentages of reovirus positive cells for three independent experiments. Error bars indicate SD. *, P < 0.05 by student's t test in comparison to T3SA+ at an equivalent MOI. NS, not significant in comparison to T3SA+ at an MOI of 0.5 PFU/cell. We note that 10PFU/cell samples are the same as those used in Figure 4. (C) ATCC L929 cells were adsorbed with T3SA+ or T3SA− at the indicated PFU/cell. Following incubation at 37°C for 48 h, cells were stained with AOEB. The results are expressed as the mean percentages of cells undergoing cell death for three independent experiments. Error bars indicate SD. *, P < 0.05 by student's t test in comparison to T3SA+ at the equivalent MOI. NS, not significant in comparison to T3SA+ at an MOI of 0.5 PFU/cell.
Fig. 6
Fig. 6. Enhanced attachment promotes cell death by increasing viral gene expression
ATCC L929 cells were adsorbed with T3SA+ at an MOI of 20 or 200 PFU/cell. (A) Increase in viral RNA levels was determined following incubation at 37°C for 6 h. The results are expressed as mean increase in RNA for three independent samples. Errors indicate SD. * P < 0.05 by student's t test in comparison to T3SA+ at MOI of 20 PFU/cell at 0 h. ** P < 0.05 by student's t test in comparison to T3SA+ at MOI of 20 PFU/cell at 6 h. (B) Following infection at 37°C for 9 h or 18 h, the fraction of infected cells was measured by indirect immunofluorescence and DAPI staining. The results are expressed as mean percentage of infected cells from three independent samples. Error bars indicate SD. * P < 0.05 by student's t test in comparison to T3SA+ at MOI of 20 PFU/cell at the comparable time point. ** P < 0.05 by student's t test in comparison to T3SA+ at MOI of 20 PFU/cell (C) Following infection at 37°C for 24 h in the presence of 0 or 200 μM ribavirin, the cells were stained with AOEB. The results are expressed as the mean percentages of cells undergoing cell death for three independent experiments. Error bars indicate SD. * P < 0.05 by student's t test in comparison to T3SA+ at an equivalent MOI. ** P < 0.05 by student's t test in comparison to T3SA+ at MOI of 20 PFU/cell in the absence of ribavirin.

References

    1. Barton ES, Connolly JL, Forrest JC, Chappell JD, Dermody TS. Utilization of sialic acid as a coreceptor enhances reovirus attachment by multistep adhesion strengthening. J Biol Chem. 2001a;276:2200–2211. - PubMed
    1. Barton ES, Forrest JC, Connolly JL, Chappell JD, Liu Y, Schnell FJ, Nusrat A, Parkos CA, Dermody TS. Junction adhesion molecule is a receptor for reovirus. Cell. 2001b;104:441–451. - PubMed
    1. Barton ES, Youree BE, Ebert DH, Forrest JC, Connolly JL, Valyi-Nagy T, Washington K, Wetzel JD, Dermody TS. Utilization of sialic acid as a coreceptor is required for reovirus-induced biliary disease. J Clin Invest. 2003;111:1823–1833. - PMC - PubMed
    1. Beckham JD, Tuttle KD, Tyler KL. Caspase-3 activation is required for reovirus-induced encephalitis in vivo. J Neurovirol. 2010;16:306–317. - PMC - PubMed
    1. Berard A, Coombs KM. Mammalian reoviruses: propagation, quantification, and storage. Current protocols in microbiology. 2009;Chapter 15(Unit15C):11. - PubMed

Publication types

LinkOut - more resources