. 2015 Jul 31:5:12617.
doi: 10.1038/srep12617.

Stochasticity and Spatial Interaction Govern Stem Cell Differentiation Dynamics

Affiliations

Stochasticity and Spatial Interaction Govern Stem Cell Differentiation Dynamics

Quinton Smith et al. Sci Rep. .

Abstract

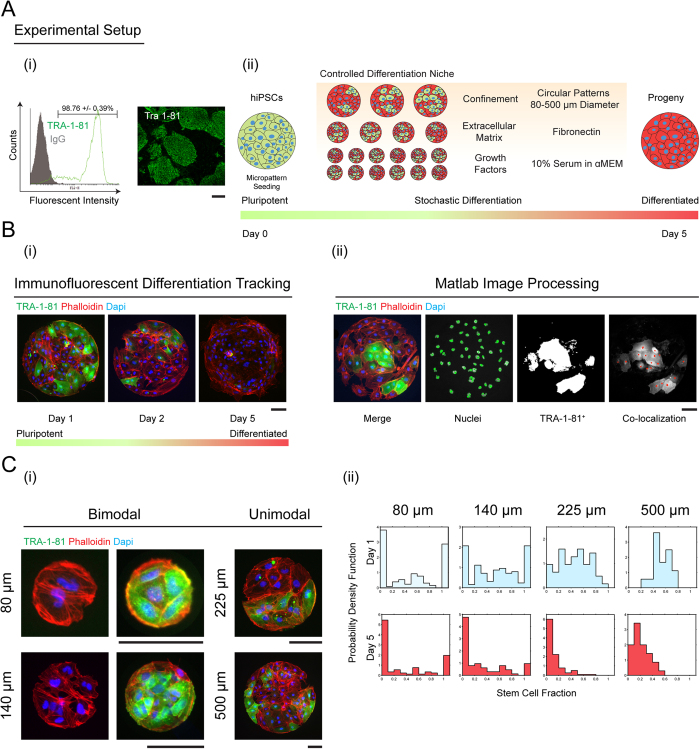
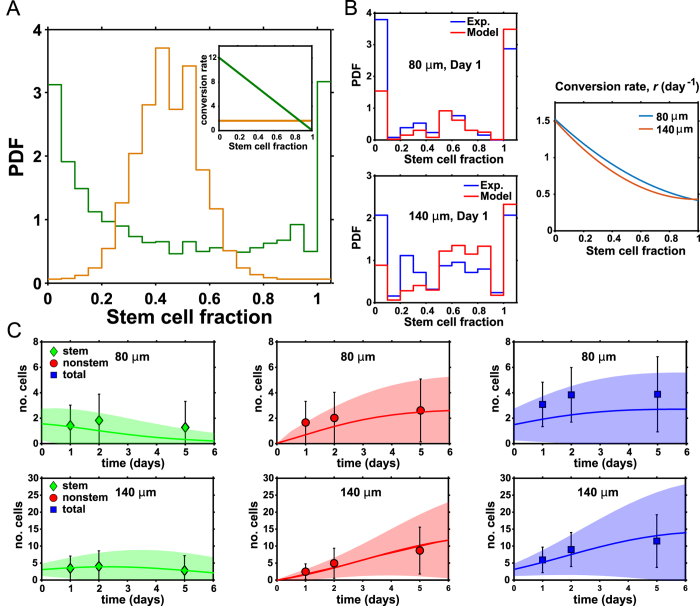
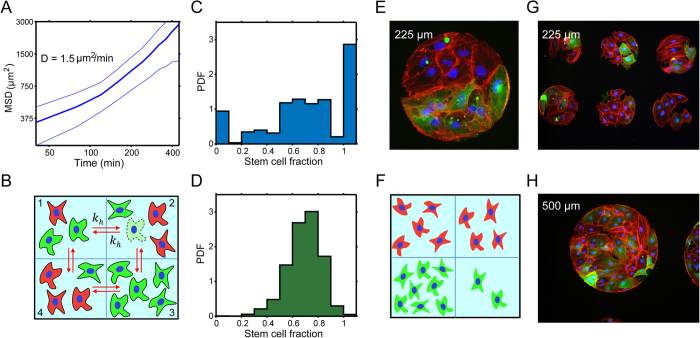
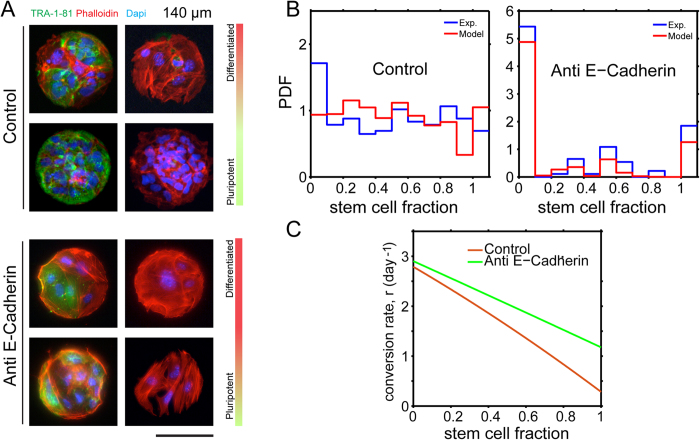
Stem cell differentiation underlies many fundamental processes such as development, tissue growth and regeneration, as well as disease progression. Understanding how stem cell differentiation is controlled in mixed cell populations is an important step in developing quantitative models of cell population dynamics. Here we focus on quantifying the role of cell-cell interactions in determining stem cell fate. Toward this, we monitor stem cell differentiation in adherent cultures on micropatterns and collect statistical cell fate data. Results show high cell fate variability and a bimodal probability distribution of stem cell fraction on small (80-140 μm diameter) micropatterns. On larger (225-500 μm diameter) micropatterns, the variability is also high but the distribution of the stem cell fraction becomes unimodal. Using a stochastic model, we analyze the differentiation dynamics and quantitatively determine the differentiation probability as a function of stem cell fraction. Results indicate that stem cells can interact and sense cellular composition in their immediate neighborhood and adjust their differentiation probability accordingly. Blocking epithelial cadherin (E-cadherin) can diminish this cell-cell contact mediated sensing. For larger micropatterns, cell motility adds a spatial dimension to the picture. Taken together, we find stochasticity and cell-cell interactions are important factors in determining cell fate in mixed cell populations.


Figures

Figure 1
Figure 1. Homogenous hiPSC population matured on circular micropatterns show non-homogeneous differentiation dynamics depending on the size of confinement.
(A) (i) hiPSCs are plated on fibronectin coated circular substrates ranging from 80–500 μm in diameter. Cell seeding density is 100,000 per coverslip. The initial cell hiPSC population is 98.67 +/− 0.39% pluripotent as demonstrated by TRA-1-81 flow cytometry and staining data. (ii) Hundreds of identical micropatterns are replicated in the same culture. Cells grow and differentiate for 5 days. (B) (i) Differentiation demonstrated by loss of green intensity (ii) The cell culture is fixed and stained at regular intervals and images are processed and quantified for each micropattern. The number of stem and differentiated cells are recorded to obtain population distributions. The image analysis algorithm is discussed in the SM. (C) (i) Representative images of stem cell populations grown for 1 day on circular micropatterns. (ii) Probability density functions of stem cell fractions quantified from (i) showing bimodal probability distributions of stem cells on smaller (80 and 140 μm) and unimodal distributions on larger (225 and 500 μm) diameter micropatterns. The 80 and 140 μm micropatterns show that it is very probable to observe a micropattern with 100% stem cells or 100% differentiated cells. For the larger 225 and 500 μm micropatterns, the opposite is true (TRA-1-81 in green; phalloidin in red; nuclei in blue; scale bars are 100 μm).
Figure 2
Figure 2. Model and experimental comparison.
(A) Quantitative modeling shows that the form of the differentiation transition probability, Eq. (2), affect the stem cell fraction distribution. From Eq. (1), if the differentiation probability r, is a constant (brown line), then the stem cell fraction distribution only shows a single peak around 50% (brown histogram). In contrast, if r is a declining function of local stem cell fraction in the micropattern, i.e., differentiation is more likely when pluripotent cells are surrounded by differentiated cells (green line), then the stem cell population shows bimodal behavior (green histogram). (B) Comparisons of experimental probability density function of stem cell fraction (blue) with mathematical model results (red). The form of the stem cell differentiation probability, r in Eq. (2), that best explain the experiment is also shown. This function is relatively independent of the micropattern size, which is consistent with modeling assumptions. (C) The model also explains the average populations of stem and differentiated cells, as well as population fluctuations. The shaded region represents the range of population fluctuation, defined by the computed standard deviation. The computed average population is the solid line and the data are symbols with measured standard deviation.
Figure 3
Figure 3. Cell motility and cell-cell interaction can explain spatial patterns seen on larger micropatterns.
(A) Measured means squared displacement versus time for stem and differentiated cells, giving a diffusion constant of 1.5 μm2/min. (B) A compartment model for large micropatterns. A 225 μm pattern can be viewed as four, 80 μm patterns connected together. Cells within each compartment are well mixed and interact with each other. Cells can also migrate between adjacent compartments, modeled by stochastic hopping rates kh. (C) Computed stem fraction probability distribution for a single compartment within the large micropattern. The compartment shows the same identical bimodal behavior as the smaller micropatterns. (D) Computed stem cell fraction distribution for the large micropattern when four compartments are summed. This distribution is unimodal, in accord with observations in Fig. 1C. (E) An example immunofluorescence image showing spatial domains within the 225 μm micropattern. Lower half are dominated by stem cells. (F) A sample simulated 225 μm micropattern, showing similar micro domains dominate by stem cells. The simulations are performed using a Gillespie algorithm described in the SM. Additional examples of immunofluorescence images of spatial patterns seen (G) on 225 μm and (H) 500 μm micropatterns after one day of differentiation. (TRA-1-81 in green; phalloidin in red; nuclei in blue; scale bars are 100μm).
Figure 4
Figure 4. Uncoupling the role of cell-cell contact and differentiation in micropatterns with E-cadherin antibody treatment.
Cell seeding density is 500,000 per cover slip. (A) In the presence of E-cadherin antibody, the fraction of differentiated cells increases after 24 hrs in culture on 140 μm diameter patterns. (B) Quantitative analysis shows that E-cadherin changes differentiation kinetics so that a larger percentage of cells are differentiating when compared to the control. (C) Modeling results show that the differentiation probability, r in Eq. (2), has changed significantly. In the control experiment, the differentiation probability at 100% stem cell fraction is less than 3 times the probability at 0% stem cell fraction. With the addition of an E-cadherin antibody, the differentiation probability at 100% stem cells is substantially higher.

References

    1. Waddington C. H. The strategy of the genes; a discussion of some aspects of theoretical biology. ix-262 (Allen & Unwin, 1957).
    1. Yu J. et al. Human Induced Pluripotent Stem Cells Free of Vector and Transgene Sequences. Science. 324, 797–801 (2009). - PMC - PubMed
    1. Takahashi K. et al. Induction of Pluripotent Stem Cells from Adult Human Fibroblasts by Defined Factors. Cell. 131, 861–872 (2007). - PubMed
    1. Chou B.-K. et al. Efficient human iPS cell derivation by a non-integrating plasmid from blood cells with unique epigenetic and gene expression signatures. Cell Res. 21, 518–529 (2011). - PMC - PubMed
    1. Wanjare M., Kuo F. & Gerecht S. Derivation and maturation of synthetic and contractile vascular smooth muscle cells from human pluripotent stem cells. Cardiovasc. Res. 97, 321–330 (2013). - PMC - PubMed