. 2015 Jul 31:15:58.
doi: 10.1186/s12874-015-0060-8.

Ranking treatments in frequentist network meta-analysis works without resampling methods

Affiliations

Ranking treatments in frequentist network meta-analysis works without resampling methods

Gerta Rücker et al. BMC Med Res Methodol. .

Abstract

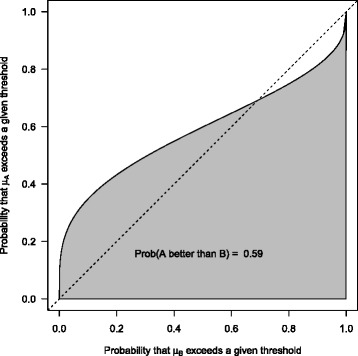
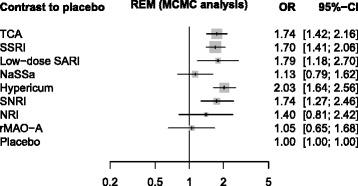
Background: Network meta-analysis is used to compare three or more treatments for the same condition. Within a Bayesian framework, for each treatment the probability of being best, or, more general, the probability that it has a certain rank can be derived from the posterior distributions of all treatments. The treatments can then be ranked by the surface under the cumulative ranking curve (SUCRA). For comparing treatments in a network meta-analysis, we propose a frequentist analogue to SUCRA which we call P-score that works without resampling.

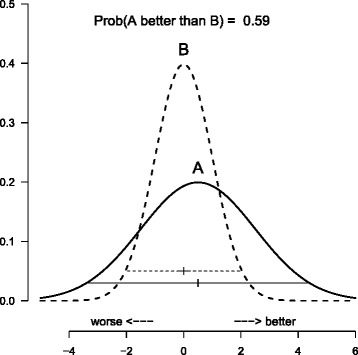
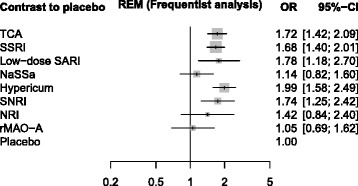
Methods: P-scores are based solely on the point estimates and standard errors of the frequentist network meta-analysis estimates under normality assumption and can easily be calculated as means of one-sided p-values. They measure the mean extent of certainty that a treatment is better than the competing treatments.

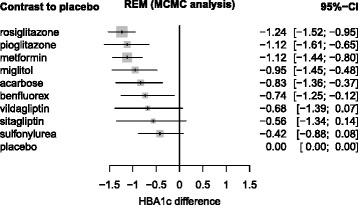
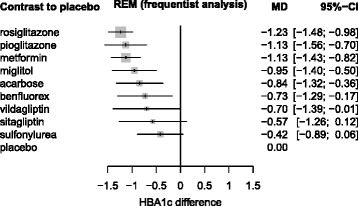
Results: Using case studies of network meta-analysis in diabetes and depression, we demonstrate that the numerical values of SUCRA and P-Score are nearly identical.

Conclusions: Ranking treatments in frequentist network meta-analysis works without resampling. Like the SUCRA values, P-scores induce a ranking of all treatments that mostly follows that of the point estimates, but takes precision into account. However, neither SUCRA nor P-score offer a major advantage compared to looking at credible or confidence intervals.


Figures

Fig. 1
Fig. 1
Fictitious example. Two normal posterior distributions following N(0,1) (dashed) and N(0.5, 22) (continuous) with credible intervals. The probability that treatment A, corresponding to the flat distribution, is better than treatment B, corresponding to the steep distribution, is 59 %
Fig. 2
Fig. 2
Fictitious example: ROC curve. ROC curve and area under the curve (AUC) corresponding to the example of Fig. 1 (AUC = 0.59)
Fig. 3
Fig. 3
Diabetes data, analyzed with WinBUGS. Diabetes data, analyzed with WinBUGS and ordered by treatment effects (REM = random effects model, MCMC = Markov Chain Monte Carlo analysis with 3 chains, 40000 iterations, 10000 burn in iterations discarded). CI = credible interval (median and 2.5 % / 97.5 % quantiles). The estimated common variance between studies was σ 2=0.1221
Fig. 4
Fig. 4
Diabetes data, analyzed with R package netmeta. Diabetes data, analyzed with R package netmeta and ordered by treatment effects (REM = random effects model, CI = confidence interval). The estimated common between study variance was τ 2=0.1087
Fig. 5
Fig. 5
Depression data, analyzed with WinBUGS. Depression data, analyzed with WinBUGS (REM = random effects model, MCMC = Markov Chain Monte Carlo analysis with 3 chains, 40000 iterations, 10000 burn in iterations discarded). CI = credible interval (median and 2.5 % / 97.5 % quantiles). The estimated common between study variance was σ 2=0.2011
Fig. 6
Fig. 6
Depression data, analyzed with R package netmeta. Depression data, analyzed with R package netmeta (REM = random effects model, CI = confidence interval). The estimated common between study variance was τ 2=0.1875

References

    1. Salanti G. Indirect and mixed-treatment comparison, network, or multiple-treatments meta-analysis: many names, many benefits, many concerns for the next generation evidence synthesis tool. Research Synth Methods. 2012;3(2):80–97. doi: 10.1002/jrsm.1037. - DOI - PubMed
    1. Bafeta A, Trinquart L, Seror R, Ravaud P. Analysis of the systematic reviews process in reports of network meta-analysis: methodological systematic review. BMJ. 2013;347:3675. doi: 10.1136/bmj.f3675. - DOI - PMC - PubMed
    1. Lee AW. Review of mixed treatment comparisons in published systematic reviews shows marked increase since 2009. J Clin Epidemiol. 2014;67(2):138–43. doi: 10.1016/j.jclinepi.2013.07.014. - DOI - PubMed
    1. Biondi-Zoccai G, editor. Network Meta-Analysis: Evidence Synthesis With Mixed Treatment Comparison. Hauppauge, New York: Nova Science Publishers Inc.; 2014.
    1. Hoaglin DC, Hawkins N, Jansen JP, Scott DA, Itzler R, Cappelleri JC, et al. Conducting indirect-treatment-comparison and network-meta-analysis studies: report of the ISPOR Task Force on Indirect Treatment Comparisons Good Research Practices: part 2. Value Health. 2011;14(4):429–37. doi: 10.1016/j.jval.2011.01.011. - DOI - PubMed

Publication types

LinkOut - more resources