. 2015 Oct;14(10):2260-9.
doi: 10.1158/1535-7163.MCT-14-0801. Epub 2015 Jul 30.

Targeting c-MYC in Platinum-Resistant Ovarian Cancer

Affiliations

Targeting c-MYC in Platinum-Resistant Ovarian Cancer

Jeyshka M Reyes-González et al. Mol Cancer Ther. 2015 Oct.

Abstract

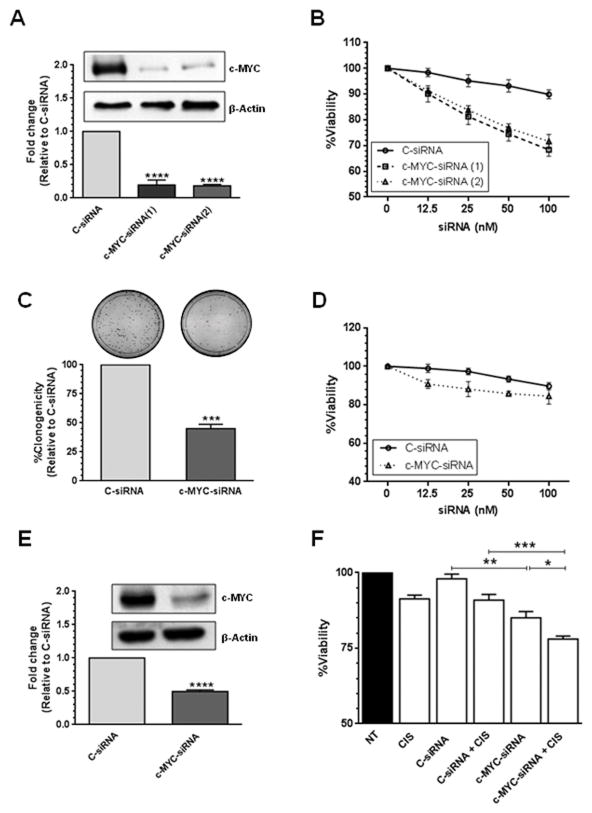
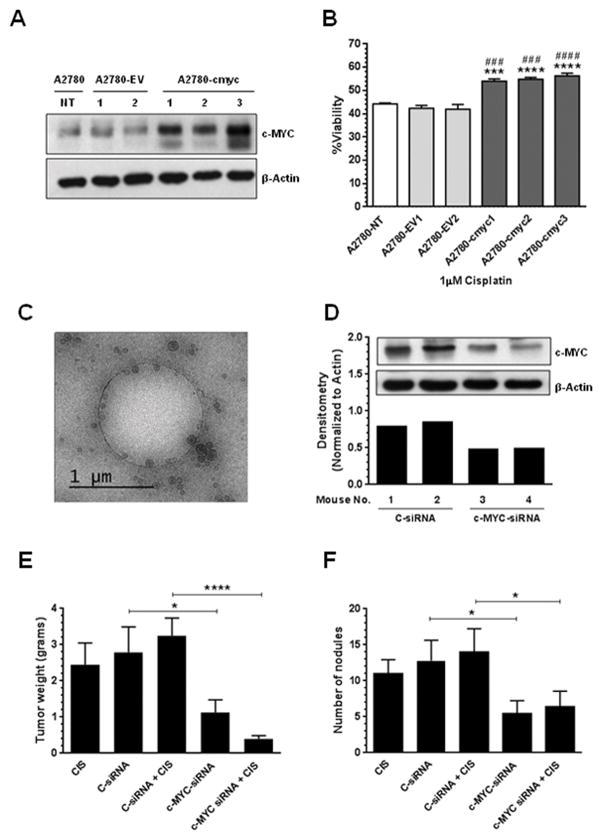
The purpose of this study was to investigate the molecular and therapeutic effects of siRNA-mediated c-MYC silencing in cisplatin-resistant ovarian cancer. Statistical analysis of patient's data extracted from The Cancer Genome Atlas (TCGA) portal showed that the disease-free (DFS) and the overall (OS) survival were decreased in ovarian cancer patients with high c-MYC mRNA levels. Furthermore, analysis of a panel of ovarian cancer cell lines showed that c-MYC protein levels were higher in cisplatin-resistant cells when compared with their cisplatin-sensitive counterparts. In vitro cell viability, growth, cell-cycle progression, and apoptosis, as well as in vivo therapeutic effectiveness in murine xenograft models, were also assessed following siRNA-mediated c-MYC silencing in cisplatin-resistant ovarian cancer cells. Significant inhibition of cell growth and viability, cell-cycle arrest, and activation of apoptosis were observed upon siRNA-mediated c-MYC depletion. In addition, single weekly doses of c-MYC-siRNA incorporated into 1,2-dioleoyl-sn-glycero-3-phosphocholine (DOPC) 1,2-distearoyl-sn-glycero-3-phosphoethanolamine-N-[methoxy(polyethylene glycol)-2000] (DSPE-PEG-2000)-based nanoliposomes resulted in significant reduction in tumor growth. These findings identify c-MYC as a potential therapeutic target for ovarian cancers expressing high levels of this oncoprotein.


Conflict of interest statement

Conflict of Interest: No conflict of interest is declared by the authors.

Figures

Figure 1
Figure 1. Expression of c-MYC in ovarian cancer cells and human tumors
Level 3 Illumina RNASeq “gene.quantification” files were used to extract MYC expression. Statistical analysis of c-MYC mRNA expression and clinical data from patients with high grade serous ovarian cancer showed that the PFS (A–B) and the OS (C–D) were significantly reduced for patients with higher c-MYC expression levels. (E) Western blot analysis of ovarian cancer cells was performed as described in the “Materials and Methods” section. β-actin was used as a loading control. (F) Densitometric analysis of the intensities of the bands shown in Figure 1E. Fold changes in protein levels were calculated relative to A2780 cisplatin-sensitive cells.
Figure 2
Figure 2. SiRNA-based silencing of c-MYC
Two different siRNAs targeting exon 2 and exon 3 of the human c-MYC sequence (NM_002467) were used. (A) A2780CP20 cells (2×10⁵) were transfected with 200 nM c-MYC-siRNA. Total protein was isolated from siRNA-transfected cells for Western blot analysis as described in the “Materials and Methods” section. Densitometric analysis of the intensities of the bands was calculated relative to the C-siRNA. Averages ±SEM are shown (****P<0.0001). (B) A2780CP20 cells (2×10³) were seeded into 96-well plates and 24-hr later cells were transfected with a serial dilution of C-siRNA or c-MYC-targeted siRNAs. Cell viability was calculated 72-hr post-transfection as described in the “Materials and Methods” section. Percentages were obtained after blank OD subtraction, taking the untreated cells values as a normalization control. Averages ±SEM are shown. (C) A2780CP20 cells (6×10⁴) were seeded into 6-well plates and 24-hr later 100 nM c-MYC-siRNA(2) or 100 nM C-siRNA was added to the cells. Eight hours post-transfection, 1000 cells were seeded into 10-cm Petri dishes. Seven days later, cells were stained and colonies of at least 50 cells were scored under a light microscope. The % of clonogenicity was calculated relative to C-siRNA. Averages ±SEM are shown for three independent experiments (***P<0.001). (D) A2780 cells (3×10³) were seeded into 96-well plates and 24-hr later cells were transfected with a serial dilution of C-siRNA or c-MYC-siRNA(2). Cell viability was calculated as described in Figure 2B. Averages ±SEM are shown. (E) A2780CP20 cells (2×10⁵) were transfected with 50 nM c-MYC-siRNA(2). Total protein was isolated from siRNA-transfected cells for Western blot analysis as described in the “Materials and Methods” section. Densitometric analysis of the intensities of the bands was calculated relative to the C-siRNA. Averages ±SEM are shown (****P<0.0001). (F) A2780CP20 cells (2×10³) were seeded into 96-well plates and 24-hr later cells were transfected with 50 nM C-siRNA or 50 nM c-MYC-siRNA(2). The next day, the media was replaced by CIS (2 μM final concentration)-containing RPMI-1640 media. Cell viability was calculated 72-hr after CIS treatment (96-hr post-transfection) as previously described. Averages ± SEM are shown (*P<0.05, **P<0.01, ***P<0.001).
Figure 3
Figure 3. Apoptosis and cell cycle progression following c-MYC silencing
Assessment of cell cycle progression and apoptosis was performed by flow cytometry after siRNA-based c-MYC silencing in cisplatin-resistant cells. (A) A2780CP20 cells (6×10⁴) were seeded into 6-well plates and 24-hr later 200 nM of C-siRNA or 200 nM of c-MYC-siRNA(2) was added to the cells. Seventy-two hours post-transfection, apoptosis was measured with the FITC-apoptosis detection kit as described in the “Materials and Methods” section. Averages ±SEM are shown for two independent experiments (**P<0.01). (B) A2780CP20 cells (2×10⁵) were seeded into 10-cm Petri dishes and transfected as described in Figure 1A. Western blot analysis was performed 72-hr post-transfection for detection of apoptotic related proteins as described in the “Materials and Methods” section. (C) A2780CP20 cells (6×10⁴) were transfected as described in Figure 3A. Forty-eight hours after siRNA transfection, A2780CP20 cells were fixed and cell cycle progression was assessed using PI and the FCS Express software. Averages ±SEM are shown for three independent experiments (**P<0.01, ****P<0.0001). (D) A2780CP20 cells (2×10⁵) were transfected as described in Figure 3B. Western blot analysis was performed 48-hr post-transfection for detection of cell cycle related proteins. (E) Densitometric analysis of the band intensities shown in Figure 3D are expressed relative to C-siRNA-treated cells. Averages ±SEM are shown for three independent experiments (*P<0.05, **P<0.01).
Figure 4
Figure 4. In vitro effects of c-MYC overexpression, and in vivo therapeutic efficacy of liposomal c-MYC-siRNA
A2780 cells (9×10⁴) were stably transfected with an empty vector (EV) or with a c-MYC-containing vector as described in the “Materials and Methods” section. (A) Western blot analysis was performed as previously described. Compared with untrasfected cells or with empty vector clones, the c-MYC overexpressing clones showed higher c-MYC protein levels. (B) Stable transfected A2780 cells were exposed to CIS (1 μM final concentration)-containing RPMI-1640 media. Cell viability was calculated as described in the “Materials and Methods” section. Averages ± SEM are shown relative to A2780-EV1 (***P<0.001, ****P<0.0001) or to A2780-EV2 (###P<0.001, ####P<0.0001). Lyophilized liposomal-siRNAs were reconstituted in Ca2+ and Mg2+-free PBS. (C) Cryo-EM shows that the majority of the particles are small unilamellar vesicles in the 100–150 nm range. The hole in the image is a fenestration in the carbon support, which measures 1.2 microns in diameter. Nude mice were injected i.p. with A2780CP20 cells and randomly allocated in the groups described in the “Materials and Methods” section. (D) Western blot analysis shows that c-MYC-siRNA-DOPC-PEG treatment reduced c-MYC protein levels in vivo. Therapy began one (1) week after tumor cell inoculation. (E) Mean tumor weight and (F) number of nodules was recorded after 4 weeks. Averages ±SEM are shown (*P<0.05, ****P<0.0001).

References

    1. Eilers M, Eisenman RN. Myc’s broad reach. Genes Dev. 2008;22:2755–66. - PMC - PubMed
    1. Grandori C, Cowley SM, James LP, Eisenman RN. The Myc/Max/Mad network and the transcriptional control of cell behavior. Annu Rev Cell Dev Biol. 2000;16:653–99. - PubMed
    1. Bui TV, Mendell JT. Myc: Maestro of MicroRNAs. Genes Cancer SAGE Publications. 2010;1:568–75. - PMC - PubMed
    1. Knoepfler PS. Myc goes global: new tricks for an old oncogene. Cancer Res. 2007;67:5061–3. - PubMed
    1. McMahon SB, Wood MA, Cole MD. The essential cofactor TRRAP recruits the histone acetyltransferase hGCN5 to c-Myc. Mol Cell Biol. 2000;20:556–62. - PMC - PubMed

Publication types

MeSH terms