. 2015 Jul 31:6:7841.
doi: 10.1038/ncomms8841.

RTN1 mediates progression of kidney disease by inducing ER stress

Affiliations

RTN1 mediates progression of kidney disease by inducing ER stress

Ying Fan et al. Nat Commun. .

Erratum in

Abstract

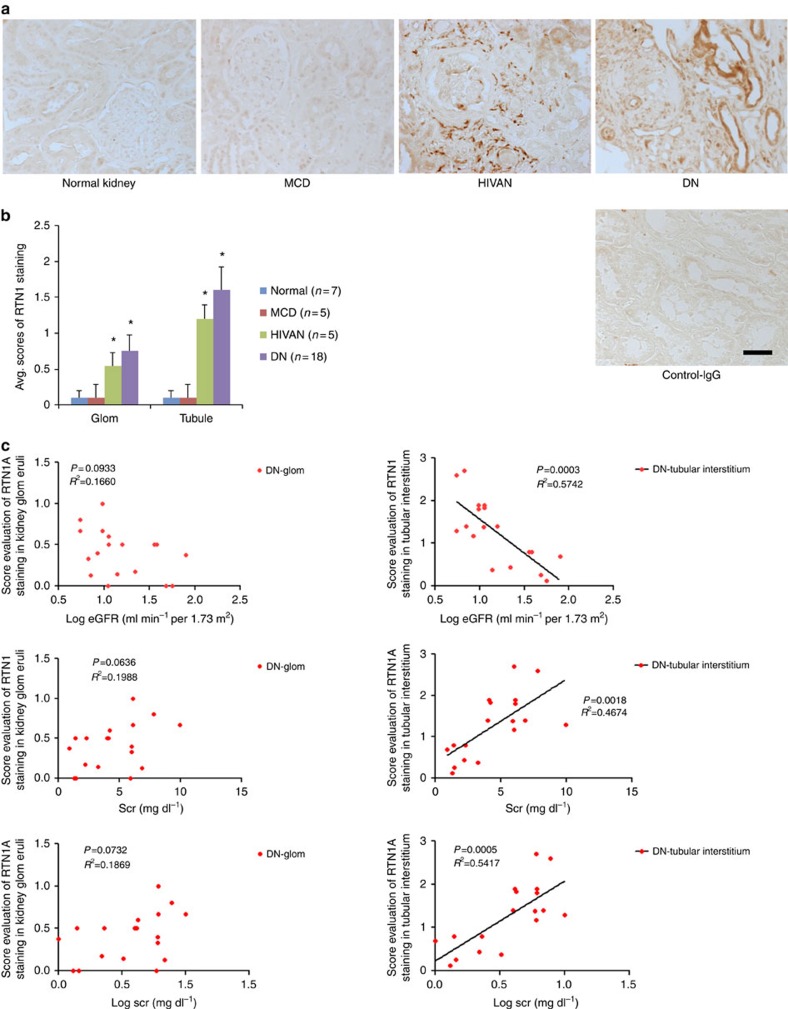
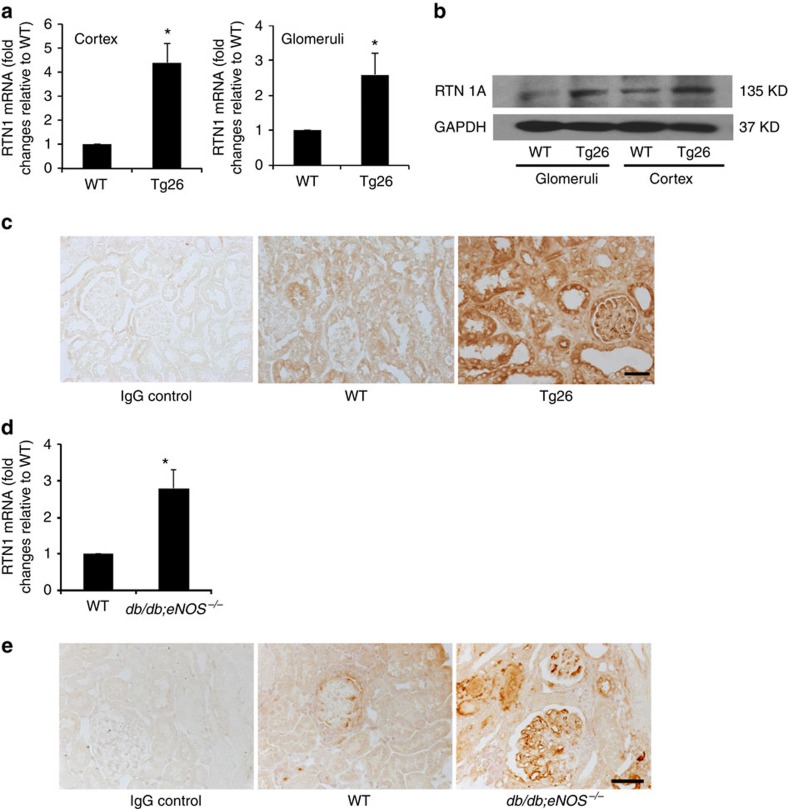
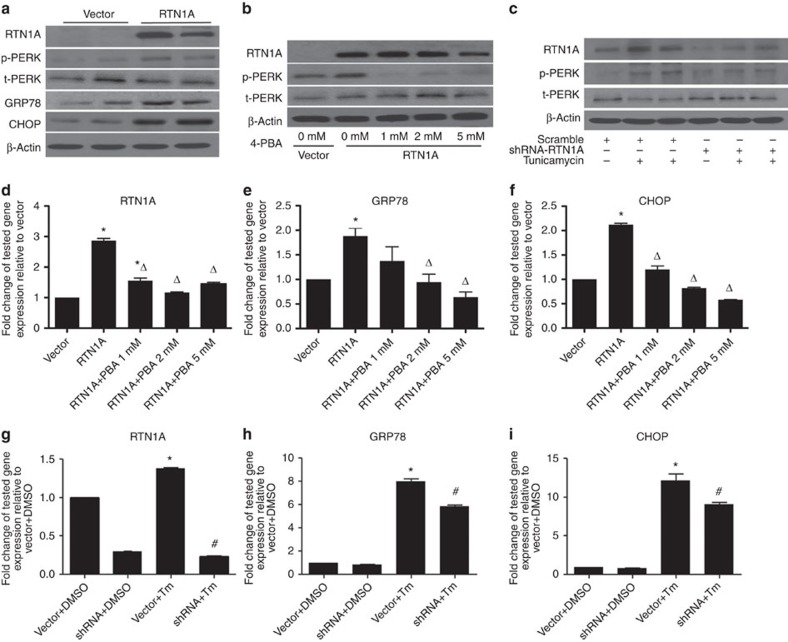
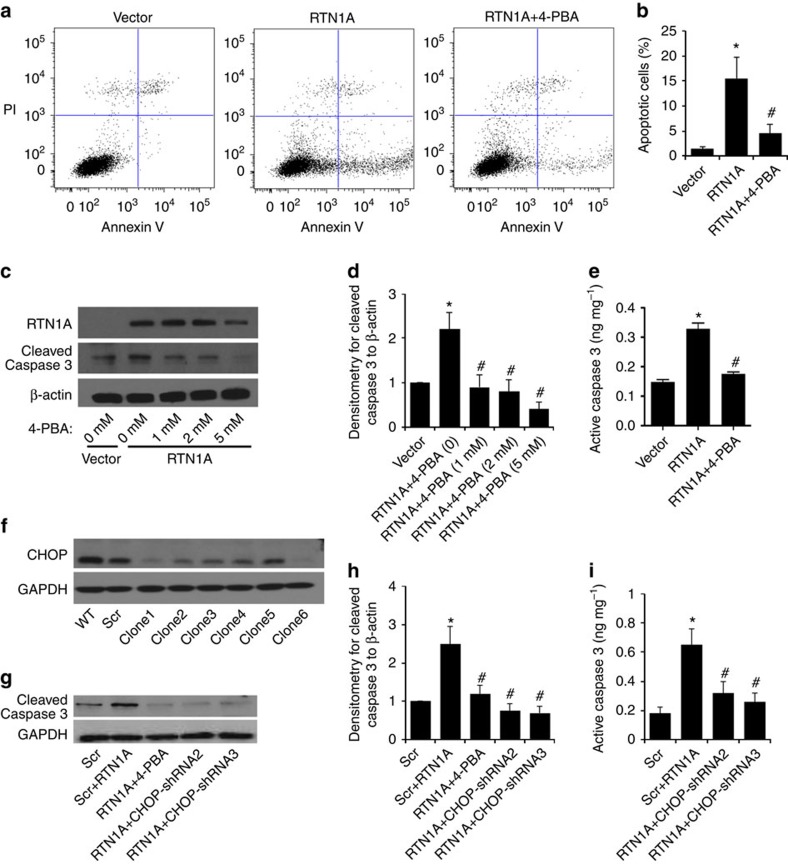
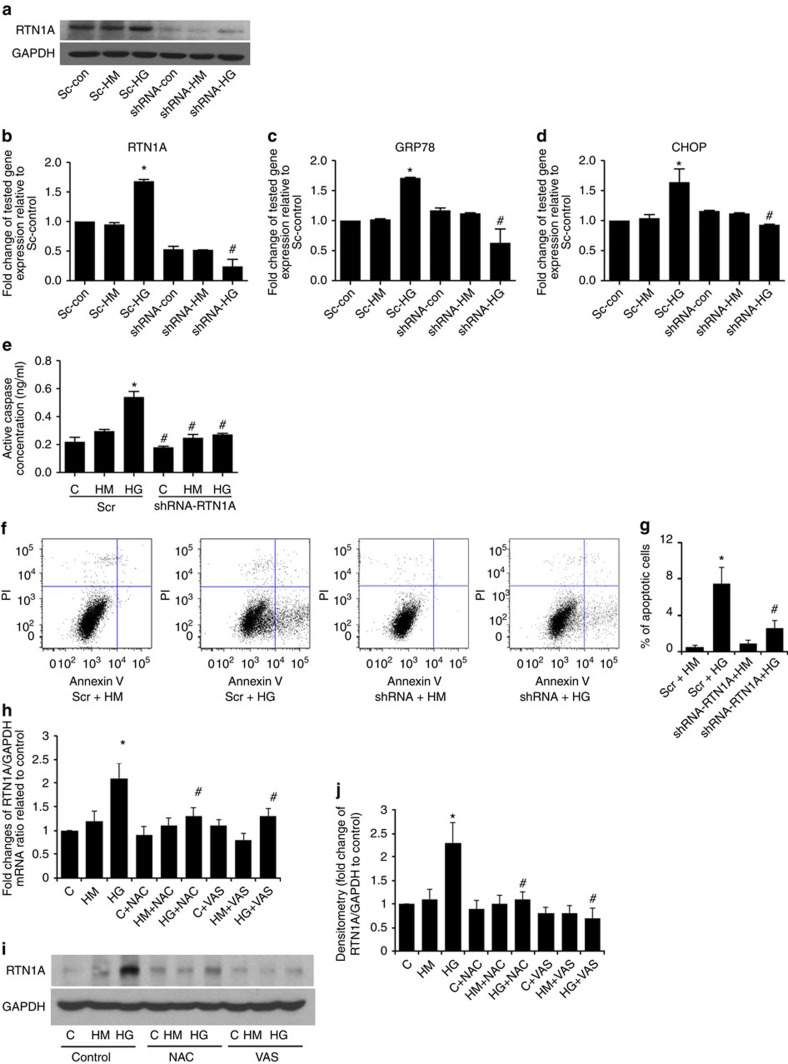
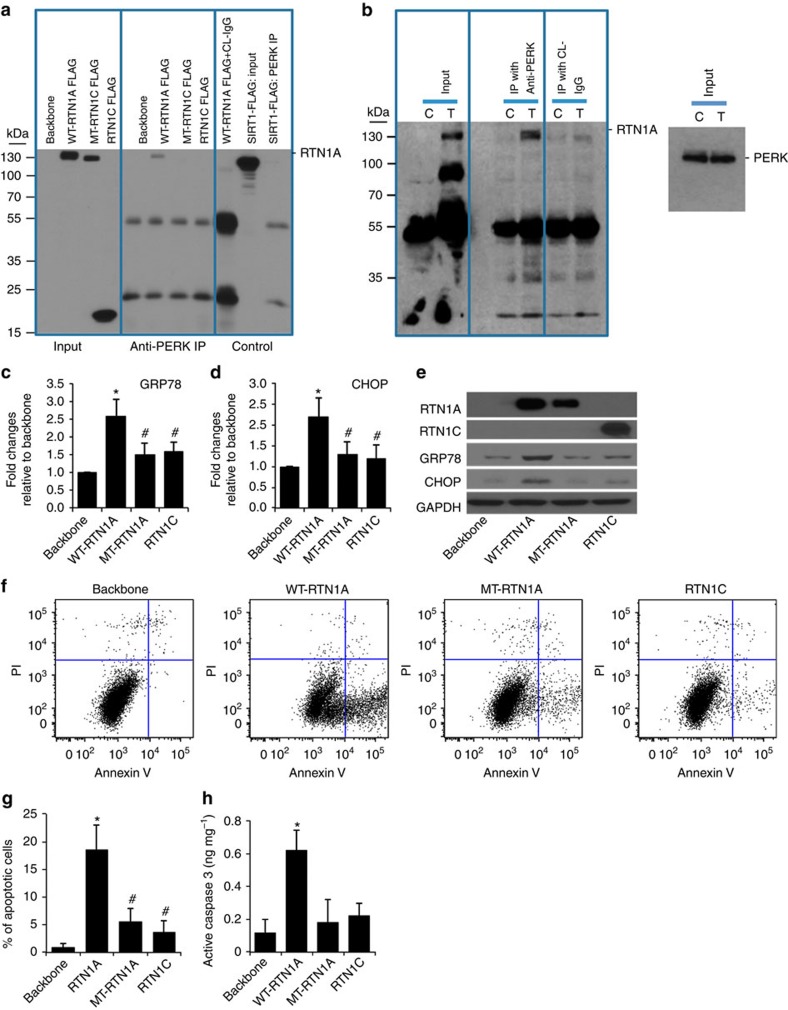
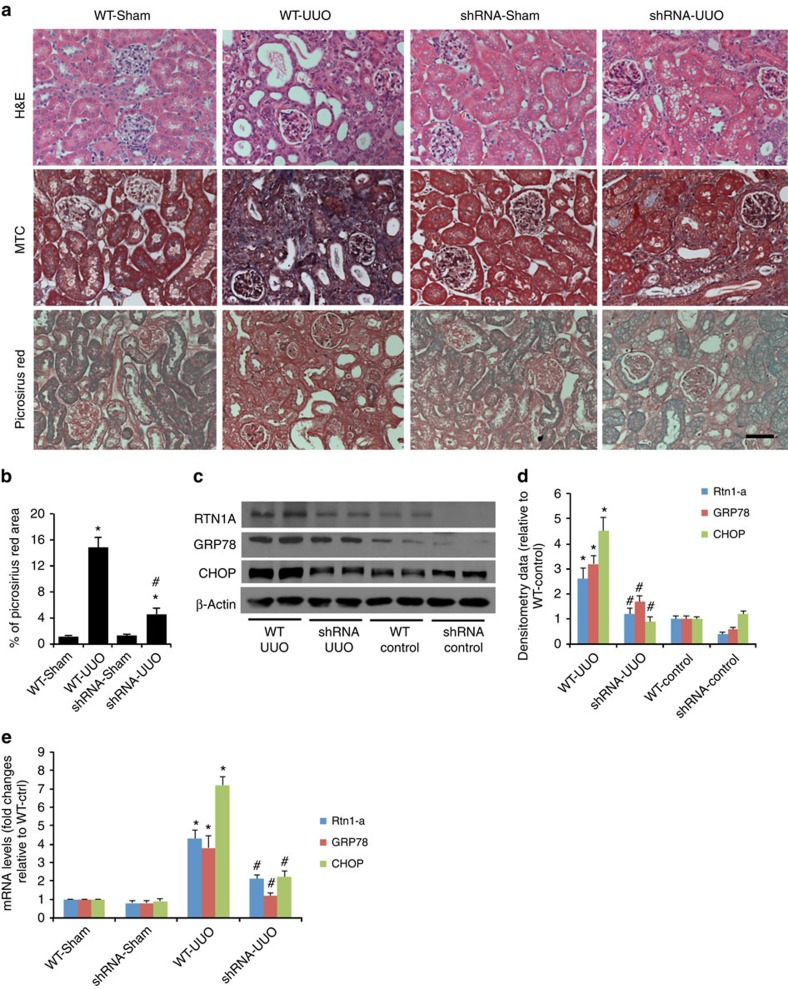
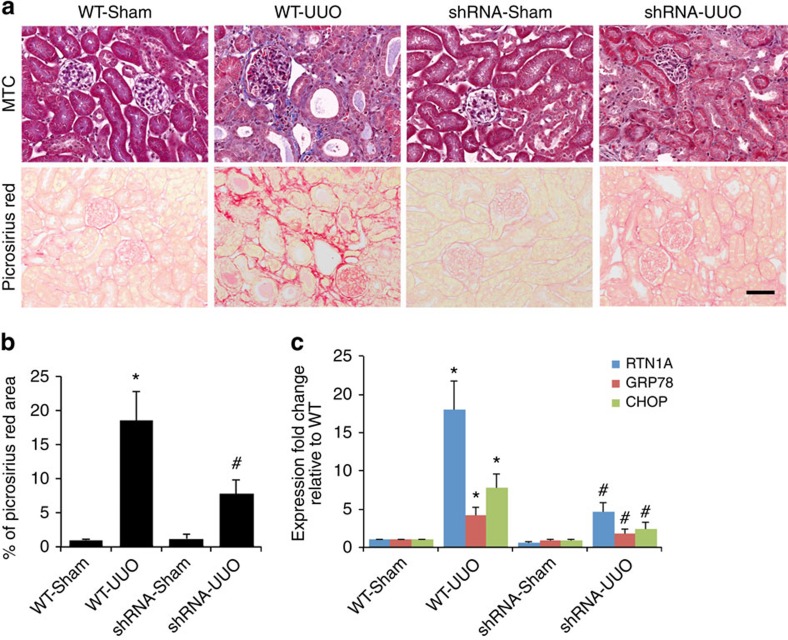
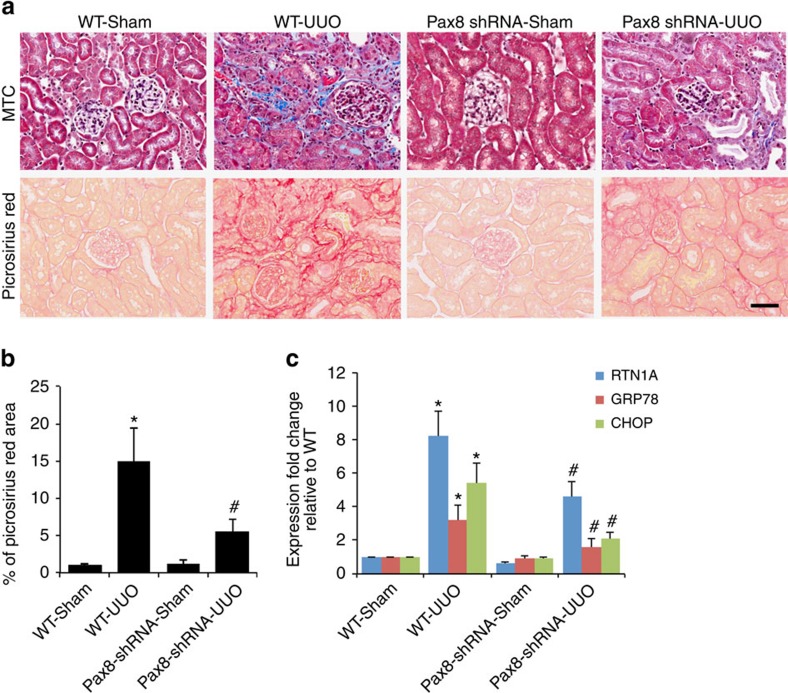
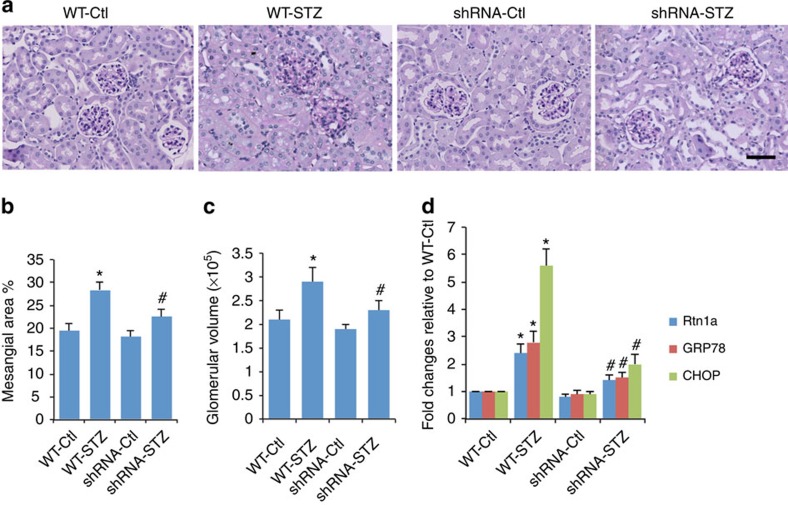
Identification of new biomarkers and drug targets for chronic kidney disease (CKD) is required for the development of more effective therapy. Here we report an association between expression of reticulon 1 (RTN1) and severity of CKD. An isoform-specific increase in the expression of RTN1A is detected in the diseased kidneys from mice and humans, and correlates inversely with renal function in patients with diabetic nephropathy. RTN1 overexpression in renal cells induces ER stress and apoptosis, whereas RTN1 knockdown attenuates tunicamycin-induced and hyperglycaemia-induced ER stress and apoptosis. RTN1A interacts with PERK through its N-terminal and C-terminal domains, and mutation of these domains prevents this effect on ER stress. Knockdown of Rtn1a expression in vivo attenuates ER stress and renal fibrosis in mice with unilateral ureteral obstruction, and also attenuates ER stress, proteinuria, glomerular hypertrophy and mesangial expansion in diabetic mice. Together, these data indicate that RTN1A contributes to progression of kidney disease by inducing ER stress.


Conflict of interest statement

: Microarray data have been deposited in NCBI GEO under accession code GSE69074.

Figures

Figure 1
Figure 1. Increased RTN1A expression is associated with progression of CKD.
(a) Representative immunostaining of RTN1A in kidney sections of patients with minimal change disease (MCD) (n=5), HIVAN (n=5) and diabetic nephropathy (DN) (n=18), as well as in normal kidneys of nephrectomy samples (n=7). Immunostaining was performed in duplicates. (b) Semi-quantitative scoring of RTN1A staining for both glomerular and tubular interstitial compartments summarized in a bar graph. *P<0.05, Scale bar, 50 μm. The data were expressed as mean±s.d. The ANOVA with Bonferroni correction was used. (c) Correlation between the intensity of RTN1A staining in glomerular or tubular compartment and renal function (eGFR or serum creatinine) was calculated in patients with DKD using Pearson and Spearman correlation analysis as described in the method. P and R2 are indicated on the graph. n=18.
Figure 2
Figure 2. Increased RTN1A in murine CKD models.
(a) Rtn1a mRNA expression in the glomeruli (Glom) and kidney cortex (Cortex) of wild-type (WT) and Tg26 mice quantified by qPCR. n=3, *P<0.05, compared with WT group. (b) Western blots of total protein lysates from Glom and Cortex. Representative blots of three independent experiments are shown. (c) Immunohistochemistry staining of kidney sections from Tg26 and WT control mice and representative images of three mice in each group are shown. Negative control with unrelated IgG is also shown. (d) mRNA expression of Rtn1a in the renal cortices of db/m;eNOS+/+ (WT) and db/db;eNOS−/− mice as determined by real-time PCR. n=3 for each group. *P<0.05, compared with WT group. (e) Immunostaining of RTN1A in kidney sections of WT and db/db;eNOS−/− mice and representative images of three mice in each group as well as negative controls with unrelated IgG are shown. Scale bar, 50 μm. Each PCR experiments were performed in triplicate. Western blot and immunostaining were performed in duplicate. The data were expressed as mean±s.d. The two-sided unpaired t-test was used.
Figure 3
Figure 3. Role of RTN1A in ER stress.
(a) HK2 cells were transfected with RTN1A or control vector for 3 days. Representative western blots for RTN1A, p-PERK, T-PERK (total PERK), GRP78, CHOP and β-actin are shown. (b) HK2 cells transfected with RTN1A were treated with an ER stress inhibitor 4-PBA at 0, 1, 2 and 5 mM. Representative western blots of RTN1A, p-PERK, T-PERK and β-actin are shown. (c) HK2 cells infected with a lentivector containing either scramble shRNA or RTN1A-shRNA were stimulated with tunicamycin (Tm) at 25 ng ml−1 or DMSO as control for 24 h. Representative western blots of RTN1A, p-PERK, T-PERK and β-actin are shown. (df) HK2 cells transfected with RTN1A or control vector were treated with an ER stress inhibitor 4-PBA at 0, 1, 2 and 5 mM. Real-time qPCR analyses for RTN1A and genes involved in ER stress markers (GRP78 and CHOP) were performed. *P<0.05, compared with vector group, ΔP<0.05, compared with RTN1A group, n=3. (gi) HK2 cells infected with either a lentivector containing scramble (vector) or RTN1A-shRNA (shRNA) were stimulated with DMSO or tunicamycin (Tm) for 24 h. Real-time PCR analysis for RTN1A and genes involved in ER stress markers (GRP78 and CHOP) were performed. *P<0.05 compared with vector+DMSO group, #P<0.05 compared with vector+Tm group, n=3. Each PCR experiment was performed in triplicate and western blots were performed in duplicate. The data were expressed as mean±s.d. The ANOVA with Bonferroni correction was used.
Figure 4
Figure 4. Role of RTN1A in apoptosis of HK2 cells.
(a) Flow cytometric analysis of HK2 cells for apoptosis after double labelling with Annexin V and propidium iodide. HK2 cells were transfected with a RTN1A expression vector (RTN1A) or an empty vector (Vector) by electroporation 5 days before the apoptosis study. RTN1A-overexpressing cells were treated with or without 4-PBA at 5 mM 24 h post-transfection. (b) Summary of apoptosis data on HK2 cells. *P<0.01 compared with vector, #P<0.05 compared with RTN1A cells, n=3. (c,d) Western blots and densitometry analysis confirmed that cleavage of Caspase-3 was increased in RTN1A overexpressed HK2 cells and inhibited by 4-PBA treatment (0, 1, 2 and 5 mM). (e) Caspase-3 activity was measured by enzyme-linked immunosorbent assay in HK2 cells transfected with RTN1A construct or vector for 5 days. RTN1A-overexpressing cells were treated with or without 5 mM 4-PBA for 24 h post-transfection. *P<0.05 compared with vector, #P<0.05 compared with RTN1A cells, n=3. (f–i) RTN1A-induced ER stress was inhibited by knockdown of CHOP using specific shRNA. The efficiency of knockdown was confirmed by western blot analysis (f). On the basis of these data, shRNA#2 and shRNA#3 were selected. Using these shRNA, we confirmed that knockdown of CHOP attenuated RTN1A-induced apoptosis as assessed by western blot analysis of cleaved Caspase-3 (g), which is confirmed by densitometry analysis (h). This was also confirmed by measurement of Caspase-3 activity in these cells (i). *P<0.01 when compared with scramble shRNA, #P<0.01 when compared with scramble shRNA+RTN1A overexpression, n=3. Each experiment of flow cytometry was performed in duplicate. Western blot was performed in triplicate. The data were expressed as mean±s.d. The two-sided unpaired t-test or ANOVA was used where are appropriate.
Figure 5
Figure 5. RTN1A mediates HG-induced ER stress and apoptosis in HK2 cells.
(a) Western blots of RTN1A using HK2 cells that were transduced with lentiviral shRNA construct targeting RTN1A (shRNA) or scrambled shRNA (Sc) as control. Four days after infection, HK2 cells were incubated with normal glucose at 6 mM (no Tx) or normal glucose with equal osmolarity of mannitol (HM) or high glucose (HG) at 30 mM for an additional 24 h. (b) mRNA expression of RTN1A and (c,d) markers of ER stress as quantified by qPCR. After knockdown of RTN1A for 3 days, HK2 cells were incubated with normal glucose (C), normal glucose with equal osmolarity of mannitol (HM), or high glucose (HG) at 30 mM for an additional 3 days. The apoptosis was assessed by measurement of Caspase-3 activity using enzyme-linked immunosorbent assay (e) and flow cytometry (f,g). *P<0.05 compared with Scramble-control group, #P<0.05 compared with Scramble-HG group, n=3. To assess whether reactive oxygen species mediates HG-induced RTN1A expression, we treated HK2 cells with C, HM and HG as above for 24 h with or without N-acetylcystein (NAC) or VAS2870 (Vas). Expression of RTN1A was assessed by qPCR (h) and western blot (i) analysis. The western blots were quantified by densitometry (j). *P<0.05 compared with control, #P<0.05 compared with HG, n=3. Each PCR experiment was performed in triplicate. Flow cytometry and western blots were performed in duplicate. The data were expressed as mean±s.d. The ANOVA with Bonferroni correction was used for multiple group analysis.
Figure 6
Figure 6. Both N and C terminals of RTN1A are required for interaction with PERK.
We generated FLAG-tagged constructs of wild-type (WT) full-length RTN1A (RTN1A), C-terminal domain deletion mutant (MT-RTN1A) and RTN1C isoform, which has only C-terminal domain of RTN1A (RTN1C), which were used to determine whether C-terminal or N-terminal domain of RTN1A is required for its interaction with PERK. Including a nonrelevant FLAG-tagged construct (FLAG-Sirt1), all constructs were overexpressed in HK2 cells for 3 days. Cell lysates were then used for IP with anti-PERK antibody and immunoblotted with anti-FLAG antibody (a). For endogenous co-IP experiments (b), HK2 cells were treated with tunicamycin (T) or DMSO (C) for 24 h. Cells were lysed for IP with anti-PERK antibody and immunoblotted with anti-RTN1A antibody. Input lysates were also assessed by western blot analysis with anti-PERK antibody. HK2 cells were transfected with either WT-RTN1A, MT-RTN1A or RTN1C for 3 days were analysed by real-time quantitative qPCR (c,d) or western blot (e) for RTN1A, RTN1C, ER stress protein GRP78 and CHOP, and GAPDH. HK2 cells transfected with WT-RTN1A, MT-RTN1A or RTN1C for 5 days were used for analysis of apoptosis by flow cytometry (f,g) and measurement of Caspase-3 activity (h). *P<0.01 compared with cells transfected with the empty backbone vector, #P<0.05 compared with WT-RTN1A, n=3. Each PCR experiment was performed in triplicate. Flow cytometry, IP and western blots were performed in duplicate. The data were expressed as mean±s.d. The ANOVA with Bonferroni correction was used for multiple group analysis.
Figure 7
Figure 7. Rtn1a knockdown before UUO mitigates fibrosis and ER stress in vivo.
(a) CAGs;Rtn1asiRNA (shRNA) and CAGs;LucsiRNA (WT) mice were fed with DOX for 3 weeks before the surgery. Mice were killed 10 days after the UUO or sham-operation (Ctl) and kidneys were removed for H&E, Masson's trichrome (MTC) and Picrosirius red staining. The representative pictures are shown, n=6. (b) The quantitation data of Picrosirius red staining was shown, *P<0.01 compared with respective control mice, #P<0.05 compared with WT-UUO mice, n=6. (ce) Kidney cortices of these mice were used for protein and RNA isolation. Western blots (c) and qPCR (e) were performed to analyse expression of Rtn1a and ER stress markers in the kidney of these mice. Western blots were analysed by densitometry (d). *P<0.05 compared with WT-Ctl, #P<0.05 compared with WT-UUO, n=6. Each qPCR experiment was performed in triplicates. The data were expressed as mean±s.d. The ANOVA with Bonferroni correction was used.
Figure 8
Figure 8. Rtn1a knockdown post-UUO attenuates renal fibrosis.
Both CAGs;Rtn1siRNA (shRNA) and CAGs;LucsiRNA (WT) mice underwent either UUO or sham-operation and then fed with DOX 3 days after the surgery. The mice were killed at 21 days post-UUO. The kidneys were removed for histology analysis (a) and the fibrosis score was determined by quantification of Picrosirius staining (b). The expression of ER stress markers was analysed by qPCR (c). *P<0.01 compared with WT-Sham, #P<0.05 compared with WT-UUO, n=6. Immunostaining was performed in duplicate. The representative pictures of six mice are shown. The data were expressed as mean±s.d. The ANOVA with Bonferroni correction was used. MTC, Masson's trichrome.
Figure 9
Figure 9. Tubule-specific Rtn1a knockdown attenuates renal fibrosis and ER stress.
To determine the specific role of RTN1A in renal tubular cells, we generated tubular cell-specific Rtn1a knockdown mice (PAX8-shRNA) by crossing Rtn1siRNA (shRNA) with Pax8-rtTA mice. PAX8-shRNA mice and their control littermates (WT) underwent UUO or sham-operation and killed 10 day after the surgery. The kidneys were removed for histology analysis (a). The renal fibrosis score was determined by quantification of Picrosirius red staining (b). The expression of ER stress markers was determined by real-time PCR analysis in these kidneys. *P<0.01 compared with WT-sham, #P<0.05 compared with WT-UUO, n=6. Immunostaining was performed in duplicate. The representative pictures of six mice are shown. The data were expressed as mean±s.d. The ANOVA with Bonferroni correction was used. MTC, Masson's trichrome.
Figure 10
Figure 10. Rtn1a knockdown protects against DN development.
CAGs;Rtn1asiRNA (shRNA) and CAGs;LucsiRNA (WT) mice were injected with STZ to induce diabetes at age of 8 weeks. Mice were fed with DOX from 10 to 24 weeks and killed at age of 24 weeks. Urine albumin was determined (Supplementary Table 5). Kidneys were removed for histology (a) and glomerular volume (b) and mesangial area (c) were quantified. (d) Renal expression of Rtn1a and ER stress markers was determined by real-time PCR. The representative pictures of kidney histology are shown. *P<0.05 compared with nondiabetic WT mice (WT-Ctl), #P<0.01 compared with diabetic WT mice (WT-STZ), n=6. Each PCR experiment was performed in triplicates. The data were expressed as mean±s.d. The ANOVA with Bonferroni correction was used.

References

    1. Coresh J. et al.. Prevalence of chronic kidney disease in the United States. JAMA 298, 2038–2047 (2007). - PubMed
    1. Lewis E. J., Hunsicker L. G., Bain R. P. & Rohde R. D. The effect of angiotensin-converting-enzyme inhibition on diabetic nephropathy. The Collaborative Study Group. N. Engl. J. Med. 329, 1456–1462 (1993). - PubMed
    1. Brenner B. M. et al.. Effects of losartan on renal and cardiovascular outcomes in patients with type 2 diabetes and nephropathy. N. Engl. J. Med. 345, 861–869 (2001). - PubMed
    1. de Zeeuw D. Unmet need in renal protection--do we need a more comprehensive approach? Contrib. Nephrol. 171, 157–160 (2011). - PubMed
    1. Masliah E. et al.. Genetic deletion of Nogo/Rtn4 ameliorates behavioral and neuropathological outcomes in amyloid precursor protein transgenic mice. Neuroscience 169, 488–494 (2010). - PMC - PubMed

Publication types

MeSH terms