

Cancer type-dependent genetic interactions between cancer driver alterations indicate plasticity of epistasis across cell types
- PMID: 26227665
- PMCID: PMC4547852
- DOI: 10.15252/msb.20156102
Cancer type-dependent genetic interactions between cancer driver alterations indicate plasticity of epistasis across cell types
Abstract
Cancers, like many diseases, are normally caused by combinations of genetic alterations rather than by changes affecting single genes. It is well established that the genetic alterations that drive cancer often interact epistatically, having greater or weaker consequences in combination than expected from their individual effects. In a stringent statistical analysis of data from > 3,000 tumors, we find that the co-occurrence and mutual exclusivity relationships between cancer driver alterations change quite extensively in different types of cancer. This cannot be accounted for by variation in tumor heterogeneity or unrecognized cancer subtypes. Rather, it suggests that how genomic alterations interact cooperatively or partially redundantly to driver cancer changes in different types of cancers. This re-wiring of epistasis across cell types is likely to be a basic feature of genetic architecture, with important implications for understanding the evolution of multicellularity and human genetic diseases. In addition, if this plasticity of epistasis across cell types is also true for synthetic lethal interactions, a synthetic lethal strategy to kill cancer cells may frequently work in one type of cancer but prove ineffective in another.
Keywords: cancer; epistasis; evolution; genetic interaction networks; tissue specificity.
© 2015 The Authors. Published under the terms of the CC BY 4.0 license.
Figures
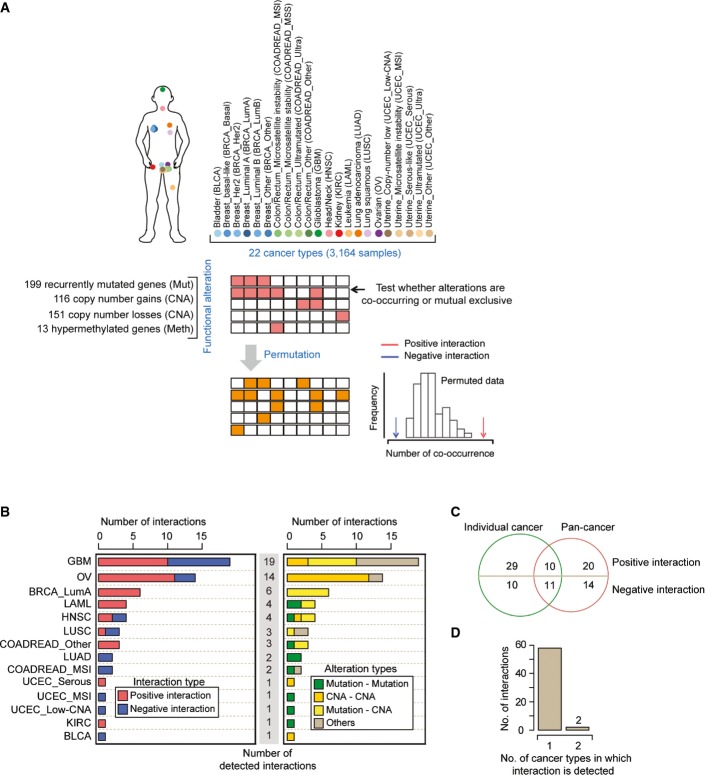
Randomization procedure to identify interactions across 22 cancer types.
Numbers of interactions, their interaction types (left), and their alteration types (right) identified in analyses of 14 different cancer types in which interactions were detected (FDR = 0.1). The remaining 8 of 22 cancer types had no detected interactions. See FigureEV1 for the same analysis at a stricter FDR (FDR = 0.05).
Overlap between the interactions detected in the pan-cancer analysis and in the analyses of individual cancer types. Of the 39 interactions only detected in the analyses of individual cancer types, 10 were also tested in the pan-cancer analysis. All of the 34 interactions only detected in the pan-cancer analysis were also tested in at least one individual cancer type.
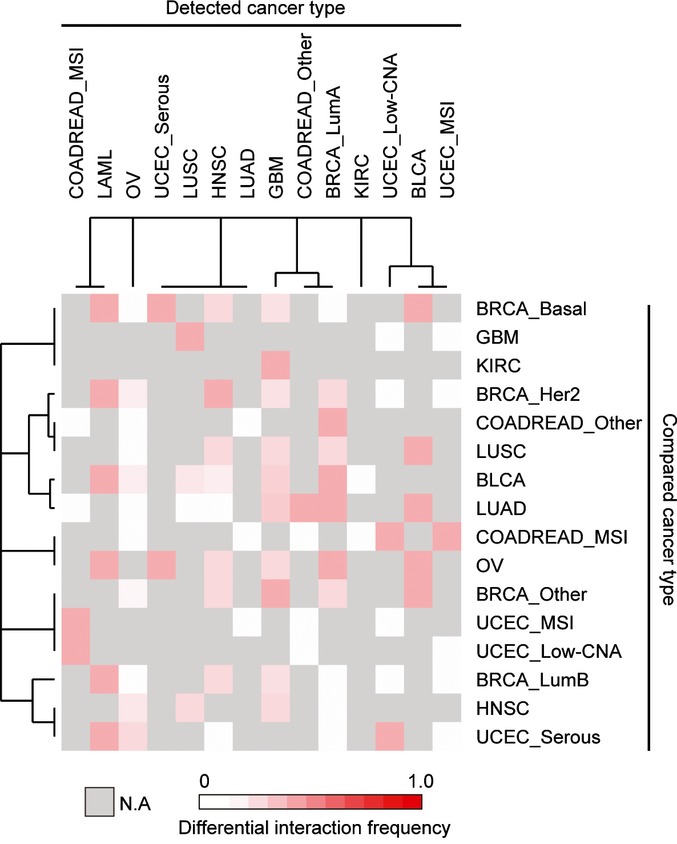
Most interactions were only detected in a single type of cancer.
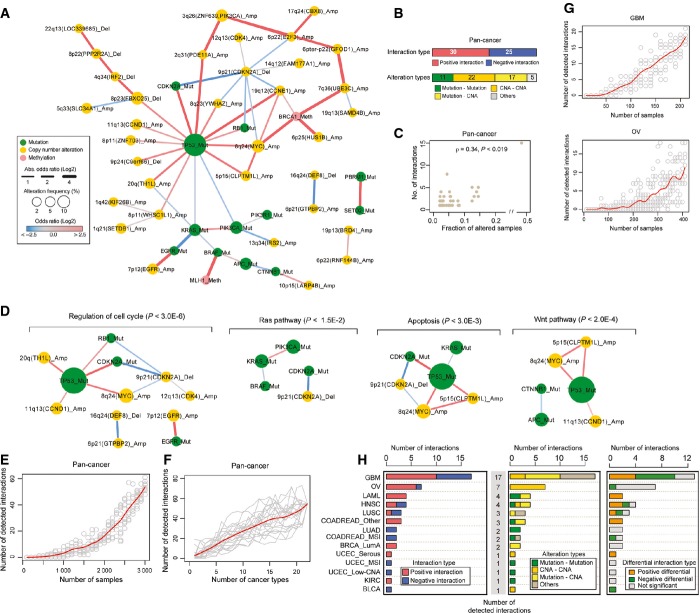
Pan-cancer epistatic interaction network when the data from the 22 cancer types are analyzed together.
Numbers of genetic interactions, their interaction types, and their alteration types identified in the pan-cancer (FDR = 0.1).
The relationship between alteration frequencies and the number of detected genetic interactions per alteration (node degree) in the pan-cancer network.
Signaling pathway enrichment in the pan-cancer network. The detected genetic interactions are shown for significantly enriched KEGG signaling pathways (hypergeometric P-value < 0.05).
Saturation analysis by adding tumors in the pan-cancer analysis. Each point indicates a randomly selected subsample from 3,164 tumors and the red line is a smoothed fit. The number of tumors in the random subset (x-axis) and the number of genetic interactions (y-axis) are plotted.
Analysis by adding cancer types in the pan-cancer analysis. Each line represents a shuffled ordering of the 22 cancer types. The number of cancer types in the random subset (x-axis) and the number of genetic interactions (y-axis) are plotted.
Analysis by adding tumors in the two cancer types in which more than 10 genetic interactions were detected. Each point indicates a randomly selected subsample from each cancer type and the red line is a smoothed fit. The number of tumors in the random subset (x-axis) and the number of genetic interactions (y-axis) are plotted.
Characterization of genetic interactions assigned at a stricter false discovery rate cutoff (FDR = 0.05). Numbers of genetic interactions detected and their interaction types (left), alteration types (middle) in the individual cancer types, and numbers of differential interactions across cancer types (right).
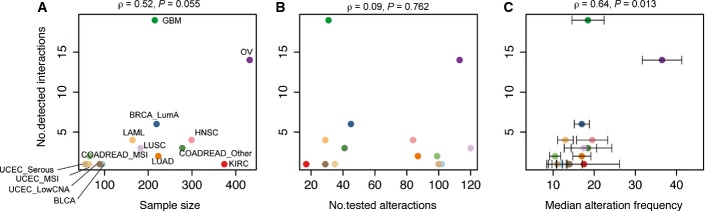
A–C The relationship between number of detected interactions and (A) sample size, (B) number of tested driver alterations, (C) median alteration frequencies of tested driver alterations. Error bars indicate standard errors.
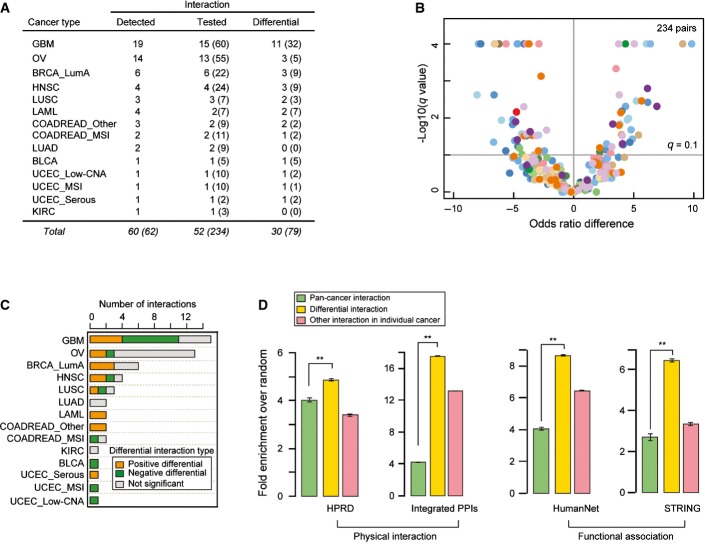
Fifty-two of sixty driver pairs detected as interacting in one cancer type could be re-tested in at least one other cancer type and 30 of these were detected as interacting differentially (FDR = 0.1). Numbers in parentheses indicate the total number of interactions re-tested and detected, including any redundancy of retesting and detection across different cancer types.
Volcano plot comparing differences of the log of the odds ratios for the co-occurrence of genomic events in two cancer types (i.e., detected cancer type and compared cancer type). A total of 52 detected interactions were re-tested a total of 234 times in additional cancer types. Color coding is for the cancer type in which the interaction was re-tested, as in Figure1.
Number of significant positive differential, significant negative differential, and non-significantly differential interactions in each cancer type. See Figure EV1 for analyses at a stricter FDR.
Enrichment for physical or functional protein–protein interactions in the pan-cancer analysis (55 pairs) or within each cancer type as differential interactions (30 pairs) or other interactions (30 pairs). Error bars denote 95% confidence intervals (**P-value < 1.0E-3).
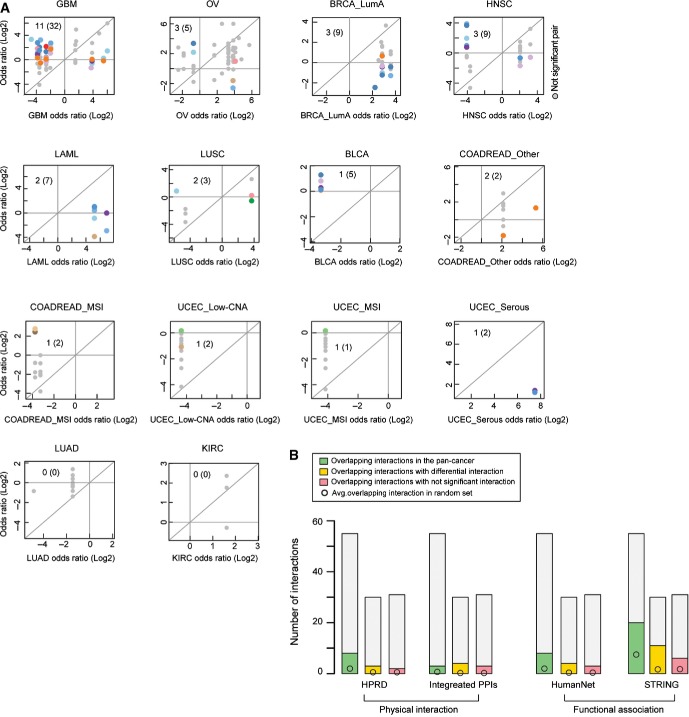
The odds ratio of co-occurrence in the cancer type in which an interaction is detected (x-axis) plotted against the odds ratio of co-occurrence in the compared cancer types (y-axis). Colored points are differential interactions (FDR = 0.1) and gray points are non-significantly differential interactions. Color coding is for the cancer type in which the interaction is re-tested, as in Figure1. Inset numbers indicate the non-redundant (redundant) number of differential interactions detected.
Numbers of physical and functional protein–protein interactions from four protein–protein interaction sets overlapping the epistatic interactions in each cancer dataset.
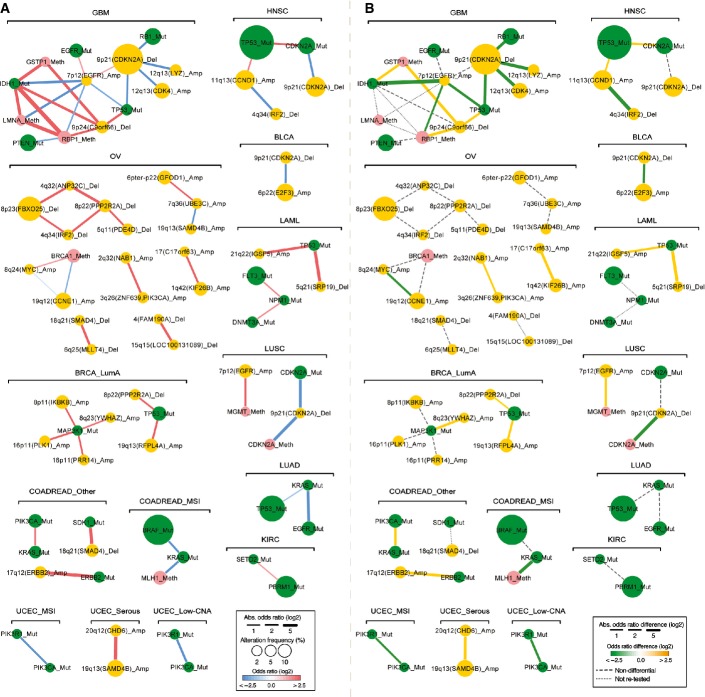
In the static network, nodes represent genomic events altered in at least 2% of the samples in each cancer type with their sizes indicating the frequency of alteration and their colors representing the type of alteration. Edge color indicates the interaction type (red: co-occurrence, blue: mutual exclusivity) and width represents the strength of interaction (absolute log of odds ratio).
In the differential network, edge color corresponds to the type of differential interaction (yellow: higher odds ratio, co-occurrence is significantly stronger in the named cancer type than in another cancer type; green: lower odds ratio, mutual exclusivity is significantly stronger in the named cancer type than in another cancer type; FDR = 0.1). Edge width indicates the strength of differential interaction (absolute difference of the odds ratios between two cancer types). Only the strongest differential odds ratio is shown for each interaction. Cancer types are abbreviated as in Figure1. All networks were drawn using Cytoscape (Smoot et al, 2011).
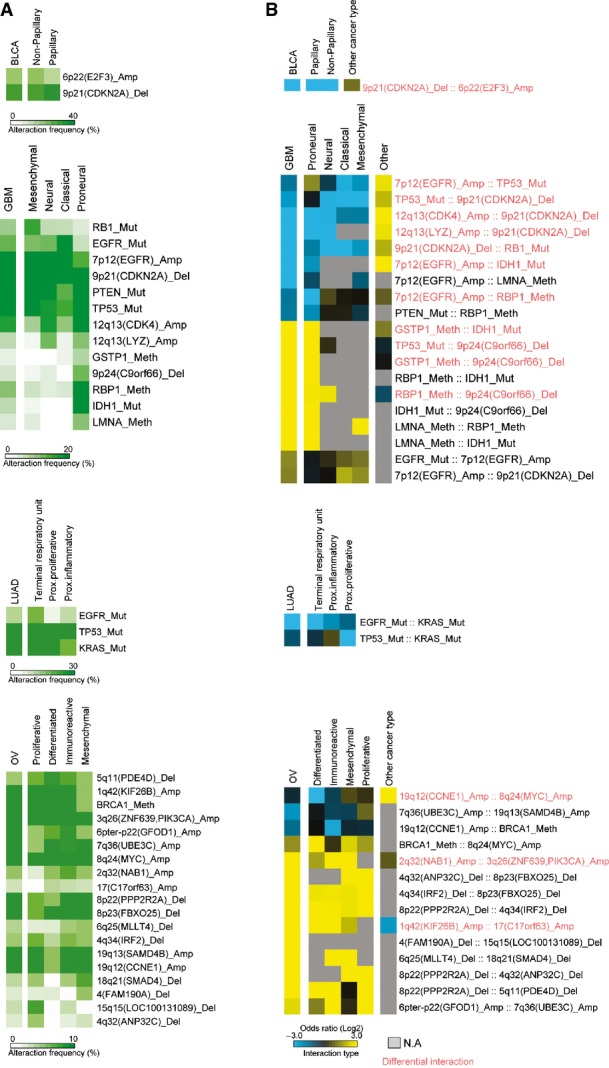
A, B (A) Alteration frequencies of cancer genes across subtypes and (B) odds ratios of the detected interactions in cancer subtypes. Molecular subtypes are as previously defined (Cancer Genome Atlas Research Network, , ,; Brennan et al, 2013).
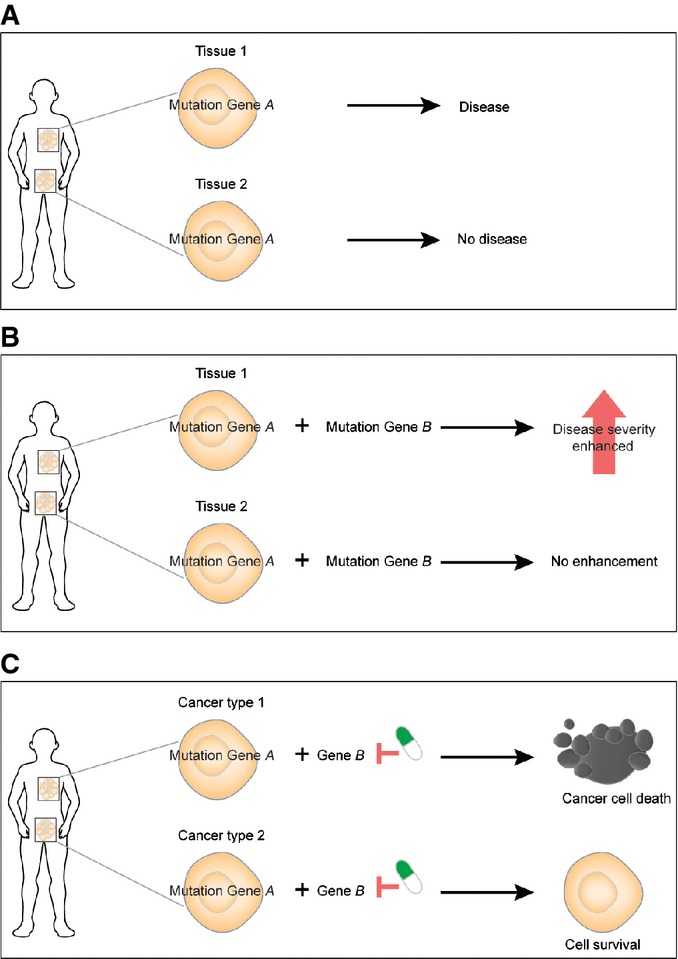
Mutations in universally expressed housekeeping genes can have cell type-specific effects because of cell type-specific epistasis.
The modifier loci of a disease gene will change across cell types.
Inhibiting a protein may cause synthetic lethality in combination with a cancer-associated genomic alteration in one type of cancer but fail in another type of cancer.
References
-
- Ashworth A, Lord CJ, Reis-Filho JS. Genetic interactions in cancer progression and treatment. Cell. 2011;145:30–38. - PubMed
-
- Bandyopadhyay S, Mehta M, Kuo D, Sung MK, Chuang R, Jaehnig EJ, Bodenmiller B, Licon K, Copeland W, Shales M, Fiedler D, Dutkowski J, Guenole A, van Attikum H, Shokat KM, Kolodner RD, Huh WK, Aebersold R, Keogh MC, Krogan NJ, et al. Rewiring of genetic networks in response to DNA damage. Science. 2010;330:1385–1389. - PMC - PubMed
-
- Banerji S, Cibulskis K, Rangel-Escareno C, Brown KK, Carter SL, Frederick AM, Lawrence MS, Sivachenko AY, Sougnez C, Zou L, Cortes ML, Fernandez-Lopez JC, Peng S, Ardlie KG, Auclair D, Bautista-Pina V, Duke F, Francis J, Jung J, Maffuz-Aziz A, et al. Sequence analysis of mutations and translocations across breast cancer subtypes. Nature. 2012;486:405–409. - PMC - PubMed
-
- Benjamini Y, Hochberg Y. Controlling the false discovery rate—a practical and powerful approach to multiple testing. J R Stat Soc B. 1995;57:289–300.
Publication types
MeSH terms
LinkOut - more resources
Full Text Sources
Other Literature Sources
Molecular Biology Databases
