. 2015 Jul 31:6:7914.
doi: 10.1038/ncomms8914.

Direct observation of multistep energy transfer in LHCII with fifth-order 3D electronic spectroscopy

Affiliations

Direct observation of multistep energy transfer in LHCII with fifth-order 3D electronic spectroscopy

Zhengyang Zhang et al. Nat Commun. .

Abstract

During photosynthesis, sunlight is efficiently captured by light-harvesting complexes, and the excitation energy is then funneled towards the reaction centre. These photosynthetic excitation energy transfer (EET) pathways are complex and proceed in a multistep fashion. Ultrafast two-dimensional electronic spectroscopy (2DES) is an important tool to study EET processes in photosynthetic complexes. However, the multistep EET processes can only be indirectly inferred by correlating different cross peaks from a series of 2DES spectra. Here we directly observe multistep EET processes in LHCII using ultrafast fifth-order three-dimensional electronic spectroscopy (3DES). We measure cross peaks in 3DES spectra of LHCII that directly indicate energy transfer from excitons in the chlorophyll b (Chl b) manifold to the low-energy level chlorophyll a (Chl a) via mid-level Chl a energy states. This new spectroscopic technique allows scientists to move a step towards mapping the complete complex EET processes in photosynthetic systems.


Figures

Figure 1
Figure 1. Three-dimensional electronic spectroscopy (3DES) pulse sequence and Liouville pathways diagrams.
(a) Pulse sequence used in coherent fifth-order 3D optical spectroscopy performed in a pulse-shaper assisted pump-probe geometry. The pulse-shaper creates a four-pulse pump sequence (red) with controllable delays and relative phases followed by the probe (green) that interacts at a small angle to emit the signal (blue). (b) A 3D cross peak (ω1, ω3, ω5)=(ωA, ωB, ωC) on a 3DES spectrum is a combination of fifth-order optical processes outlined in the Liouville pathways (double-sided Feynman diagrams) depicted above. The shaded areas denote the population periods where EET processes proceed between the states separated by the dashed lines. The label of the processes R1, R2, R3 and R4 follows the convention of Hamm.
Figure 2
Figure 2. Linear and 2DES spectrum of LHCII.
(a) The experimental linear absorption spectrum of LHCII (solid blue) and the excitation pump spectrum (solid filled pink). (b) Two-dimensional spectrum of LHCII at population time t2=0.3 ps, with the white line indicating the diagonal of the spectra. (c) The amplitude evolution of the integrated exciton cross peaks 657→670 nm and 657→678 nm as a function of population time t2. A multistep EET process can be inferred from the associated decay of the 657→670 nm cross peak and the rise of the 657→678 nm cross peak.
Figure 3
Figure 3. Three-dimensional electronic spectroscopy (3DES) spectrum of LHCII.
Spectrum recorded at population times t2=0.3 ps and t4=800 fs. The isosurface represents amplitude values of 0.1 relative to the global maximum. The cutaway at λ5=685 nm to better illustrate the features and structure of the 3D spectra. The prominent feature to note is the ridge along the λ5 axis, around λ1=655, λ3=670. The ridge's shape and feature evolves with the different population times t4 in our experiments.
Figure 4
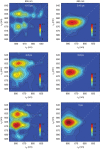
Figure 4. Two-dimensional slices of 3DES spectra.
Slices of the 3D spectra of LHCII at λ1=655 nm and λ1=665 nm to obtain quasi-2D spectra, with selected quasi-2D spectra shown at population times t2=0.3 ps and t4=0.2, 0.8 and 5 ps (indicated on the plots). The colour scale represents amplitudes relative to the respective 3D spectrum's global maximum.
Figure 5
Figure 5. Population time dependence of 3D cross peak amplitude.
Experimental values (blue circles) and simulation trace (blue line) of the H/M/L cross peak amplitudes in the quasi-2D spectra (λ1=656 nm slice; t2=0.3 ps) as a function of the second population time t4.

References

    1. Jonas D. M. Two-dimensional femtosecond spectroscopy. Annu. Rev. Phys. Chem. 54, 425–463 (2003). - PubMed
    1. Cho M. Coherent two-dimensional optical spectroscopy. Chem. Rev. 108, 1331–1418 (2008). - PubMed
    1. Mukamel S., Tanimura Y. & Hamm P. Coherent multidimensional optical spectroscopy. Acc. Chem. Res. 42, 1207–1209 (2009). - PubMed
    1. Brixner T. et al.. Two-dimensional spectroscopy of electronic couplings in photosynthesis. Nature 434, 625–628 (2005). - PubMed
    1. Engel G. S. et al.. Evidence for wavelike energy transfer through quantum coherence in photosynthetic systems. Nature 446, 782–786 (2007). - PubMed

Publication types

LinkOut - more resources