. 2015 Jul 31;349(6247):1261669.
doi: 10.1126/science.1261669.

Control of signaling-mediated clearance of apoptotic cells by the tumor suppressor p53

Affiliations

Control of signaling-mediated clearance of apoptotic cells by the tumor suppressor p53

Kyoung Wan Yoon et al. Science. .

Abstract

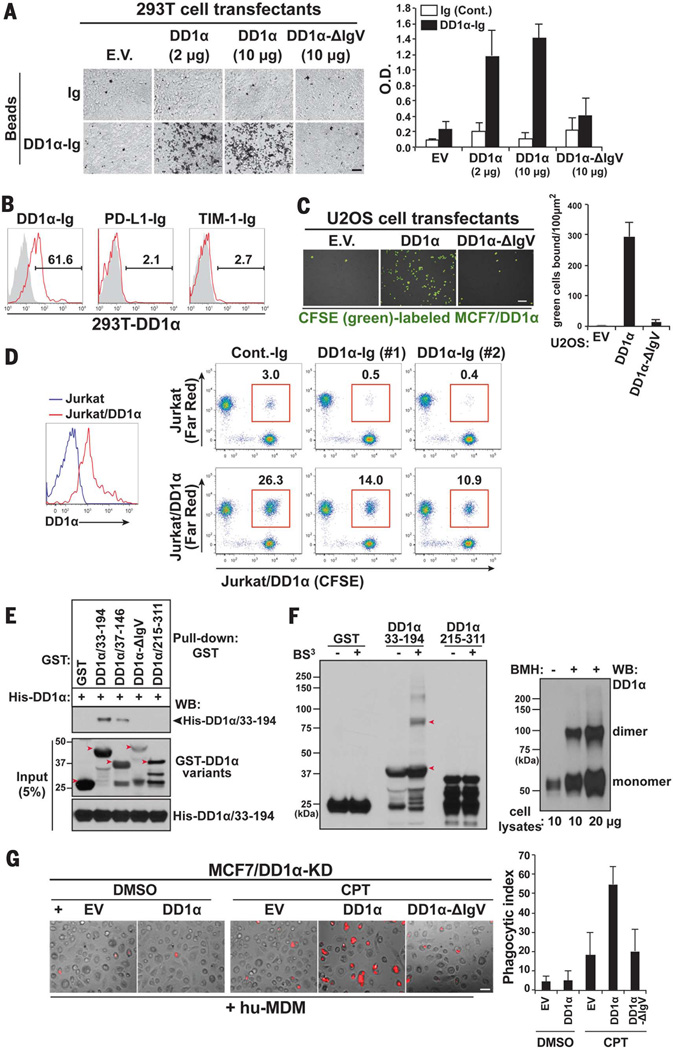
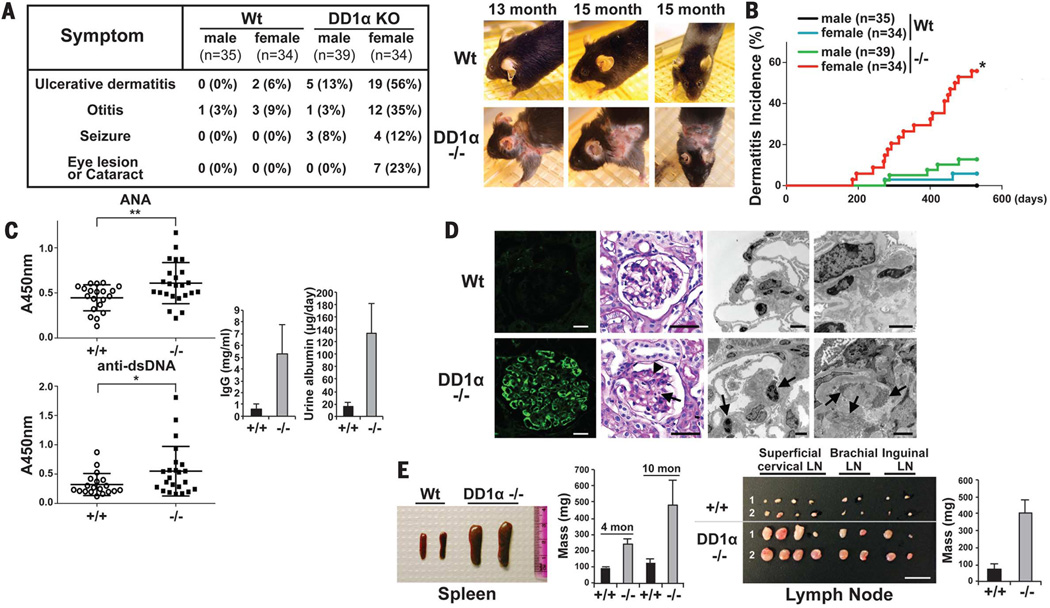
The inefficient clearance of dying cells can lead to abnormal immune responses, such as unresolved inflammation and autoimmune conditions. We show that tumor suppressor p53 controls signaling-mediated phagocytosis of apoptotic cells through its target, Death Domain1α (DD1α), which suggests that p53 promotes both the proapoptotic pathway and postapoptotic events. DD1α appears to function as an engulfment ligand or receptor that engages in homophilic intermolecular interaction at intercellular junctions of apoptotic cells and macrophages, unlike other typical scavenger receptors that recognize phosphatidylserine on the surface of dead cells. DD1α-deficient mice showed in vivo defects in clearing dying cells, which led to multiple organ damage indicative of immune dysfunction. p53-induced expression of DD1α thus prevents persistence of cell corpses and ensures efficient generation of precise immune responses.


Figures

Fig. 1
Fig. 1. Identification of DD1α as a p53 target gene
(A) p53-dependent expression of DD1α. DD1α mRNA and protein were assessed after tetracycline (tet) removal in EJ-p53tet cells (tet-off) (top). MCF7 cells (bottom) were transfected with either siRNA targeting p53 or luciferase control for 24 hours, then treated with CPT (500 nM). MCF7 cells were treated with Nutlin-3 (10 µM) for the indicated times. Northern blots were used to determine mRNA expression of p53, DD1α, p21, and 36B4. Western blotting was performed with specific Abs against p53, DD1α, p21, and β-actin. (B) p53 binds to and transactivates the DD1α promoter. Luciferase reporter constructs containing the putative p53 recognition sites in the DD1α promoter were cotransfected with either Wt-p53, mutant p53 (V143A), or pcDNA3.1 empty vector into U2OS cells. Results represent mean ± SD from three experiments. ChIP was performed on MCF7 cells exposed to IR (13 Gy). Immunoprecipitation was carried out with Ab against p53 (DO-1) or mouse IgG (negative control). The % input of coprecipitating DNAs was measured by qPCR and presented as mean ± SD (n = 3). (C) The expression of human DD1α mRNA was analyzed by Northern blotting from various human tissues, including blood leukocyte (Lk), lung (Lu), placenta (PI), small intestine (SI), liver (Li), kidney (Ki), spleen (Sp), thymus (Tm), colon (Co), skeletal muscle (Sm), heart (He), and brain (Br). Multiple sequence alignment of the IgV domains of DD1α and its homologous proteins. The predicted secondary structures are shown below the alignment as blue e for β strand and red h for α helix. The identical amino acids are in red box, the conserved amino acids are in yellow box, and the consensus amino acids are in green box. (D) p53-dependent expression of immune checkpoint regulators PD-1 and PD-L1. MCF7 cells were treated with 10 µM Nutlin-3 for 1 to 3 days. MCF7 cells were transfected with control siRNA or p53 siRNA for 24 hours and treated with 500 nM CPTor DMSO for 1 or 2 days. The levels of indicated proteins (TIM-1, TIM-3, TIM-4, PD-L1, and PD-1) were analyzed by Western blot analysis. Total RNAs from control siRNA or p53 siRNA transfected MCF7 cells were assessed for mRNA levels of PD-1 or PD-L1 by real-time quantitative PCR. PD-1 or PD-L1 mRNA levels were normalized to 36B4 expression and shown as mean ± SD (n = 3). ZR75-1 cells treated with 500 nM CPT or A375 cells exposed to IR (13 Gy) for indicated times.
Fig. 2
Fig. 2. DD1α plays essential roles in apoptotic cell engulfment
(A) DD1α on apoptotic cells contributes to apoptotic cell engulfment. MCF7 cells were transfected with shRNAs including control (luciferase) or DD1α (two different target sequences: #1, #2) or p53 (two different target sequences: #1, #2) and were treated with CPT (10 to 20 µM) for 48 hours to induce apoptosis. Then, apoptotic MCF7 cells were labeled with pHrodo, incubated with hu-MDMs for 2 hours, and examined by immunofluorescence microscopy to detect phagocytosis (red fluorescence: engulfed MCF7 cells). Where indicated, MCF7 cells expressing DD1α shRNA (#1) were transfected for 24 hours with siRNA targeting p53 or a vector encoding DD1α before the phagocytosis assay. More than 400 macrophages were counted. Data are mean ± SD from three experiments. The representative images of phagocytosis with control, DD1α, p53, both DD1α and p53 knockdowned, and DD1α-reintroduced MCF7 cells plus hu-MDMs are shown. Scale bar, 100 µm. (B) Resistance of DD1α−/− cancer cells to phagocytosis. Phagocytic indices of DD1α-induced cancer cells (MCF7, ZR75-1, A375), DD1α-nonresponsive cancer cells (BxPC-3, Hs888. T), and DD1α-reintroduced DD1α-absent cancer cells (BxPC-3/DD1α, Hs888T/DD1α) were determined using hu-MDMs, as shown in Fig. 2A. The levels of DD1α protein were examined by Western blot analysis. (C) Engulfment of Wt, DD1α−/−, and p53−/− apoptotic thymocytes by mouse bone marrow–derived macrophages (m-BMDMs) isolated from Wt mice was assessed by flow cytometry analysis. Thymocytes isolated from Wt, DD1α−/−, or p53−/− mice were exposed to IR (2 to 10 Gy) to induce apoptotic populations. The pHrodo-labeled mouse thymocytes (live or apoptotic: live Wt, dead Wt, dead DD1α−/−, or dead p53−/−) were incubated with Wt m-BMDMs for 30 min. Phagocytosis was determined by the percentage of macrophages containing positive pHrodo signal. Data are shown as mean ± SD and representative of three independent experiments. (D) Engulfment of Wt, DD1α−/−, and p53−/− apoptotic thymocytes by m-BMDMs was assessed by time-lapse imaging analysis. CFSE (green)–labeled apoptotic Wt, DD1α−/−, or p53−/− thymocytes were incubated with PKH26 red-labeled Wt m-BMDMs. The images of phagocytosis were taken every 1 min after incubation. The representative images of engulfments were shown, and arrowheads indicate the engulfed thymocytes. Data represent mean ± SD from three different experiments.
Fig. 3
Fig. 3. Impaired clearance of apoptotic cells in the DD1α-null mice
(A) Photographs of representative thymus from Wt and DD1α−/− mice at indicated time points after exposure or nonexposure to IR (6.6 Gy). Total cell numbers per thymus from Wt and DD1α−/− mice were determined at 8 hours after ionizing irradiation. Mean ± SD, n = 4 per group. **P < 0.01 (Tukey’s test). The right panels represent whole sections of thymus from Wt and DD1α−/− mice exposed to IR that were stained with TUNEL (red) and 4′,6-diamidino-2-phenylindole (DAPI; blue). Scale bar, 1 mm. The percentage of TUNEL-positive cells was determined by percent of the TUNEL-positive cells per DAPI-positive cells using imaging analysis program (CellSens Dimension, Olympus). Data represent mean ± SD, n = 4. (B) Spleens of Wt and DD1α−/− mice exposed to IR. Four- to five-week-old Wt and DD1α−/− mice were treated with 6.6 Gy IR. After 6 hours, spleens were isolated from mice and the splenic weight was measured. The photograph of representative spleens of Wt and DD1α−/− mice exposed to IR is shown. Each dot represents the value for a single mouse, and mean ± SD (n = 5) is shown. **P < 0.01 (Tukey’s test). (C) Apoptotic cells in lymph nodes and colon of Wt and DD1α−/− mice. The cryosections were stained with TUNEL and DAPI. The apoptotic cells were determined by counting TUNEL-positive cells per mm2 under a fluorescence microscope. Mean ± SD, n = 3. Scale bar, 50 µm.
Fig. 4
Fig. 4. DD1α expression on macrophages is required for apoptotic cell engulfment
(A) Engulfments of apoptotic thymocytes by Wt and DD1α−/− m-BMDMs were assessed by flow cytometry. The pHrodo-labeled apoptotic thymocytes were incubated with m-BMDMs for 30 min, and the phagocytosis was determined by measuring the positive pHrodo-containing macrophages. Graph represents mean ± SD from three experiments. (B) DD1α deficiency in macrophages does not influence engulfment of synthetic beads. Bone marrow–derived macrophages (m-BMDM) from Wt and DD1α−/− mice were incubated with carboxylate-modified green fluorescent beads (synthetic beads) for indicated times. The phagocytosis was determined by the percentage of macrophages containing positive green fluorescence signal. Data are shown as mean ± SD and are representative of three experiments at the same time. (C) The phagocytic potential of Wt and DD1α−/− m-BMDMs for E. coli was assessed using pHrodo-labeled E. coli. The phagocytosis was determined by the percentage of macrophages containing positive pHrodo signal. Data represent mean ± SD (n = 3) and are representative of three experiments at the same time.
Fig. 5
Fig. 5. Intercellular homophilic DD1α interaction between apoptotic cells and phagocytes mediates apoptotic cell engulfment
(A) Homophilic DD1α interaction. Binding of blue latex beads coated with DD1α-Ig fusion proteins (the extracellular region of DD1α fused with the immunoglobulin G Fc segment) to 293T cells transfected with empty vector (EV), the Wt DD1α (2 or 10 µg), or a mutant lacking the IgV domain (DD1α-ΔIgV). Ig protein–coated beads were included as control. After 30 min, unbound beads were washed. The binding was examined under an inverted microscope (left) and also determined from the optical density (O.D.) at 492 nm (right). Data are shown as mean ± SD and are representative of three experiments. Scale bar, 50 µm. (B) Interaction of DD1α with DD1α on the cell surface. 293T cells stably transfected with DD1α cDNA were stained with DD1α-Ig, PD-L1–Ig, TIM-1-Ig, or control Ig proteins (gray filled). The binding of Ig proteins was detected with Ab against human IgG1-PE. Binding amounts were determined by percentage of fluorescence-positive cells compared with control Ig protein–bound cells. (C) Intercellular DD1α interaction. Binding of CFSE-labeled DD1α-overexpressing apoptotic MCF7 cells to U2OS cells expressing empty vector (EV), full-length DD1α, or DD1α-ΔIgV (IgV deletion mutant). Scale bar, 100 µm. Binding was determined by counting the bound cells per 100 µm2 and normalized by cell number bound to untreated plate. Mean ± SD of three experiments is shown. (D) Intercellular DD1α-DD1α interaction and the disruption by recombinant DD1α proteins. The exogenous expression of DD1α in Jurkat cells was validated by flow cytometry analysis (left). CFSE-labeled DD1α-overexpressing Jurkat cells were pre-incubated with Ig proteins (control Ig: 50 µg/ml; DD1α-Ig: 25 µg/ml for #1,50 µg/ml for #2) for 30 min and mixed with Far Red–labeled control or DD1α-overexpressing Jurkat cells. After 1-hour incubation, DD1α-DD1α-mediated intercellular bindings were analyzed by counting the percentage of CFSE-and Far Red-positive populations (right). (E) Mapping of binding site for homophilic DD1α interaction. His-DD1α (33–194) protein was incubated with GST-DD1α variants (the extracellular region, 33–194; the immunoglobulin domain, 37–146; IgV-deleted mutant, the cytoplasmic region, 215–311) immobilized on glutathione-agarose beads. The bead-bound His-DD1α (33–194) proteins were eluted and detected by immunoblotting using Ab against His. A portion (5%) of the input proteins for the binding reaction was also subjected to immunoblotting. (F) Self-association of the extracellular region of DD1α in solution. GST-DD1α (33–194), GST-DD1α (215–311), or control protein GST was untreated or treated with 2.5 mM BS3 cross-linker for 1 hour at 4°C, and GST proteins were analyzed by Western blotting using Ab against GST (left). Dimerization of DD1α was also examined in intact cells. DD1α-transfected 293T cells were treated or untreated with 1 mM bis(maleinido)hexane (BMH) for 1 hour, and DD1α protein was analyzed by Western blotting under nonreducing condition (right). (G) Extracellular IgV domain is required for engulfment. DD1α, DD1α-ΔIgV (IgV-deleted DD1α mutant), and control empty vector were reintroduced into DD1α-depleted MCF7 cells, and the cells were treated with DMSO or CPT (10 µM) for 48 hours. The phagocytosis of MCF7/DD1α knocked-down cells expressing empty vector (EV), DD1α, or DD1α-ΔIgV was determined as in Fig. 2A. Graph represents mean ± SD (n = 3). Scale bar, 50 µm.
Fig. 6
Fig. 6. DD1α-deficient mice develop autoimmune and severe inflammatory disorder
(A) Inflammatory phenotype of DD1α−/− mice. DD1α−/− mice (34 females, 39 males) and control Wt mice (34 females, 35 males) were observed over a 19-month period. The left box summarizes the symptoms (ulcerative dermatitis, otitis, seizure, and eye lesion) and incidences of symptoms. Photographs of 13- or 15-month-old female Wt and DD1α−/− mice are shown. (B) Dermatitis incidence in DD1α−/− mice (34 females and 39 males) and control Wt mice (34 females and 35 males). *P < 0.001 (Log-rank test). (C) The levels of ANA and Abs against dsDNA in sera of phenotypically affected female Wt and DD1α−/− mice were measured by ELISA. (Wt: n = 20, DD1α−/−n = 24 for ANA; and Wt: n = 19, DD1α−/−: n = 23 for Abs against dsDNA). Each dot represents the value for a single mouse. **P < 0.01, *P < 0.05 (Student’s t test). Serum IgG levels of phenotypically affected 10-month-old female Wt and DD1α−/− mice (n = 7) were assessed by ELISA. The level of albumin in urine collected for 24 hours from affected 10- to 12-month-old female mice (n = 8) was analyzed by SDS–polyacrylamide gel electrophoresis (SDS-PAGE) and imaging analysis. (D) Spontaneous glomerulonephritis in DD1α−/− mice. Representative images of kidney sections from 10-month-old Wt and DD1α−/− mice stained with Ab against mouse IgG show immune complex deposits in glomeruli of DD1α−/− mice (the first column of panels). Scale bar, 20 µm. The second column of panels shows kidney sections from Wt and DD1α−/− mice stained with PAS. Glomeruli from Wt mice have a regular architecture with delicate mesangium. Glomeruli from DD1α−/− mice with dermatitis symptoms show diffuse mesangial expansion by PAS-positive material and cellular debris (arrowhead), as well as occasional neutrophils within capillary lumens (arrow). Scale bar, 50 µm. The third column of panels shows low-magnification electron micrographs of Wt and DD1α−/− glomeruli. A normal architecture with delicate mesangium and intact filtration barrier of Wt glomeruli and an expanded mesangium with electron-dense deposits, and neutrophils within capillary lumens (arrows) of DD1α−/− glomeruli are shown. Scale bar, 2 µm. The fourth column of panels show high magnification electron micrograph of the glomerular mesangium of Wt and DD1α−/− glomeruli. Large electron-dense deposits (arrows), often with tubular substructure in the glomerular mesangium of DD1α−/− glomeruli are shown. Scale bars, 2 µm (top) and 500 nm (bottom). (E) Splenomegaly and lymphadenopathy observed in DD1α−/− mice. Spleens and lymph nodes of 10-month-old female Wt and DD1α−/− mice from one littermate were shown. The weight of spleen and lymph nodes was measured as indicated. Data represent mean ± SD. n = 6 to ~11 mice per group.

Comment in

References

    1. Nagata S, Hanayama R, Kawane K. Autoimmunity and the clearance of dead cells. Cell. 2010;140:619–630. pmid: 20211132. - PubMed
    1. Elliott MR, Ravichandran KS. Clearance of apoptotic cells: Implications in health and disease. J Cell Biol. 2010;189:1059–1070. pmid: 20584912. - PMC - PubMed
    1. Muñoz LE, Lauber K, Schiller M, Manfredi AA, Herrmann M. The role of defective clearance of apoptotic cells in systemic autoimmunity. Rheumatology. 2010;6:280–289. pmid:20431553. - PubMed
    1. Nagata S. Apoptosis and autoimmune diseases. Ann. N. Y. Acad. Sci. 2010;1209:10–16. pmid: 20958310. - PubMed
    1. Poon IK, Lucas CD, Rossi AG, Ravichandran KS. Apoptotic cell clearance: Basic biology and therapeutic potential. Nat. Rev. Immunol. 2014;14:166–180. pmid: 24481336. - PMC - PubMed

Publication types

MeSH terms