. 2015 Sep 18;290(38):22891-906.
doi: 10.1074/jbc.M115.665125. Epub 2015 Jul 30.

Cystic Fibrosis Transmembrane Conductance Regulator (CFTR): CLOSED AND OPEN STATE CHANNEL MODELS

Affiliations

Cystic Fibrosis Transmembrane Conductance Regulator (CFTR): CLOSED AND OPEN STATE CHANNEL MODELS

Valentina Corradi et al. J Biol Chem. .

Abstract

The cystic fibrosis transmembrane conductance regulator (CFTR) is a member of the ATP-binding cassette (ABC) transporter superfamily. CFTR controls the flow of anions through the apical membrane of epithelia. Dysfunctional CFTR causes the common lethal genetic disease cystic fibrosis. Transitions between open and closed states of CFTR are regulated by ATP binding and hydrolysis on the cytosolic nucleotide binding domains, which are coupled with the transmembrane (TM) domains forming the pathway for anion permeation. Lack of structural data hampers a global understanding of CFTR and thus the development of "rational" approaches directly targeting defective CFTR. In this work, we explored possible conformational states of the CFTR gating cycle by means of homology modeling. As templates, we used structures of homologous ABC transporters, namely TM(287-288), ABC-B10, McjD, and Sav1866. In the light of published experimental results, structural analysis of the transmembrane cavity suggests that the TM(287-288)-based CFTR model could correspond to a commonly occupied closed state, whereas the McjD-based model could represent an open state. The models capture the important role played by Phe-337 as a filter/gating residue and provide structural information on the conformational transition from closed to open channel.

Keywords: ABC transporter; chloride transport; cystic fibrosis; cystic fibrosis transmembrane conductance regulator (CFTR); molecular modeling.


Figures

FIGURE 1.
FIGURE 1.
Structural organization of the CFTR domains. Cartoon representation of the homology models built using the structure of TM(287–288) (A), ABC-B10 (B), McjD (C), and Sav1866 (D). TMD1 (transmembrane helices 1–6) and NBD1 are shown in blue, and TMD2 (transmembrane helices 7–12) and NBD2 are shown in green. The TM helix number is shown in white. Coupling helices 1–4 are shown in orange, cyan, magenta, and yellow cartoons, respectively. E–H, top view of the NBDs of the model based on TM(287–288) (E); ABC-B10 (F); McjD (G); and Sav1866 (H). NBD1 is shown as blue surface and NBD2 as green surface. Coupling helices color-coded as in A–D. The nucleotides present in the structures used as templates are shown as sticks. In this orientation, the lower composite site is the degenerate site and the upper one is the consensus site.
FIGURE 2.
FIGURE 2.
Transmembrane helix axes. A–D, view from the extracellular side of the helix axes of the CFTR model based on TM(287–288), red (A); ABC-B10, orange (B); McjD, violet (C); and Sav1866, yellow (D). E–H, superimposition of the transmembrane helix axes of different CFTR models color-coded as in A–D.
FIGURE 3.
FIGURE 3.
Water density within the pore. A–D, number density of water molecules is shown as a blue volume map for the model based on TM(287–288) (A), ABC-B10 (B), McjD (C), and Sav1866 (D). TM6 and TM12 are shown as blue and green cartoons, respectively, and selected residues along these helices are shown as spheres for reference. The helix number is shown in white.
FIGURE 4.
FIGURE 4.
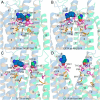
Narrow region of the pore around Phe-337. A–D, structures of the CFTR model based on TM(287–288) (A), ABC-B10 (B), McjD (C), and Sav1866 (D) obtained at the end of the equilibration steps are shown as blue (TMD1) and green (TMD2) cartoons. Residues forming a first constriction from the intracellular side in the TM(287–288)-based CFTR model (A) are shown as orange sticks. Hydrophobic residues surrounding Phe-337 are shown as magenta sticks. This constriction is not present in the ABC-B10 model (B), but in the McjD-based model (C), it allows water molecules to flow through. The helix number is shown in white.
FIGURE 5.
FIGURE 5.
TM1 and TM12 residues in the narrow region of the pore. A–D, water density is shown as a blue volume map for the model based on TM(287–288) (A), ABC-B10 (B), McjD (C), and Sav1866 (D), as shown in Fig. 3. TM1 and TM12 are as blue and green cartoons, respectively, using the same orientation as in Fig. 3. Selected residues along these helices are shown as spheres for reference. The helix number is shown in white.
FIGURE 6.
FIGURE 6.
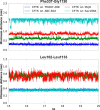
Minimum distance between Phe-337 and Gly-1330 and between Leu-102 and Leu-1133. The minimum distance between Phe-337 and Gly-1130 (upper panel) and between Leu-102 and Leu-1133 (lower panel) was calculated for each model during the last 5 ns of the equilibration performed with no position restraints on the protein side chains.
FIGURE 7.
FIGURE 7.
Outer mouth of the pore. A–D, top view of the CFTR models based on TM(287–288) (A), ABC-B10 (B), McjD (C), and Sav1866 (D). Residues contributing to closing the cavity on the extracellular side of the TM(287–288)-based model and additional residues contributing to the outer vestibule are shown as sticks.
FIGURE 8.
FIGURE 8.
Outer-mouth of the pore and cavity shape. A and B, top view of the main transmembrane cavity (white transparent surface) of the CFTR models based on TM(287–288) (A), and McjD (B). The extracellular end of the transmembrane helices completely closes the cavity in the closed state model (A), although an opening is detected in the open state model (B). TM1, -2, and -6 of TMD1 and TM7 and -12 of TMD2 are shown as blue and green cartoons, respectively. The remaining transmembrane helices are shown as transparent cartoons. Leu-102, Phe-337, and Arg-117 of TMD1 are shown as blue sticks, and Gly-1130 of TM12 is shown as green sticks.
FIGURE 9.
FIGURE 9.
Transmission interface. In the CFTR model based on McjD (A) and on Sav1866 (B), the relative orientation of the intracellular loops bearing the coupling helices and the NBDs with the X-loop motifs is very similar. Because of the dimerized NBDs, the conserved X-loop residues (NBD2-Asp-1341 and NBD1-Glu543, yellow spheres) are within cross-linking distance with residues of ch1 (orange) and ch3 (magenta). In the CFTR model based on TM(287–288) (C) and on ABC-B10 (D), the X-loop residues are not interacting with the coupling helices of the opposite TMD.
FIGURE 10.
FIGURE 10.
Lateral openings in the intracellular side of the channel. Top view of the larger opening identified on the CFTR model based on McjD (A). The opening is highlighted by a red arrow, and surrounding residues of TM3 (Ser-182, Leu-183, Asn-186, and Lys-190), TM6 (Lys-370), and TM4 (Arg-248, Asp-249, and Arg-251 oriented toward TM5, not shown, Ala-252) are shown as sticks. The water density is shown as blue volume map. The corresponding region in the CFTR model based on Sav1866 is shown in B.
FIGURE 11.
FIGURE 11.
Conserved aromatic residues in the intracellular loops. Tyr-161 of TM2 and Phe-1078 of TM11 form a pair of aromatic residues that are highly conserved among ABC transporters. A–D, CFTR model based on TM(287–288) (A), ABC-B10 (B), McjD (C), and Sav1866 (D). TMD1 and TMD2 are shown as blue and green cartoons, respectively. Coupling helices 1 and 4 are shown in orange and yellow, respectively. The NBDs are not shown for clarity.
FIGURE 12.
FIGURE 12.
From closed to open channel. A and B, top view of the CFTR model based on TM(287–288) (A) and McjD (B) here described as a closed and an open state channel, respectively. In the closed state (A), the extracellular ends of TM1, -2, -6, and -5 (TMD1) and TM7, -8, -11, and -12 (TMD2) are distributed along two hypothetical parallel lines, forming the interface between TMD1 and TMD2. Upon channel opening (B), this alignment shifts, thus allowing access to the pore. C and D, view from the intracellular side of the transmembrane cavity of the closed (C) and open (D) models. TMD1 and TMD2 are shown in blue and green cartoons, respectively. A and B, Leu-102, Phe-337, Gly-1130 and Leu-1133, contributing to the narrow region of the pore, are shown as sticks. C and D, functionally important residues on the intracellular side of the cavity (Lys-95, Gln-98, Arg-352, Asp-985, Asp-993, and Gln-1148) are shown as sticks.

References

    1. Rommens J. M., Iannuzzi M. C., Kerem B., Drumm M. L., Melmer G., Dean M., Rozmahel R., Cole J. L., Kennedy D., Hidaka N., et al. (1989) Identification of the cystic fibrosis gene: chromosome walking and jumping. Science 245, 1059–1065 - PubMed
    1. Cheng S. H., Gregory R. J., Marshall J., Paul S., Souza D. W., White G. A., O'Riordan C. R., Smith A. E. (1990) Defective intracellular transport and processing of CFTR is the molecular basis of most cystic fibrosis. Cell 63, 827–834 - PubMed
    1. Dalemans W., Barbry P., Champigny G., Jallat S., Dott K., Dreyer D., Crystal R. G., Pavirani A., Lecocq J. P., Lazdunski M. (1991) Altered chloride ion channel kinetics associated with the ΔF508 cystic fibrosis mutation. Nature 354, 526–528 - PubMed
    1. Gadsby D. C., Vergani P., Csanády L. (2006) The ABC protein turned chloride channel whose failure causes cystic fibrosis. Nature 440, 477–483 - PMC - PubMed
    1. Riordan J. R. (2005) Assembly of functional CFTR chloride channels. Annu. Rev. Physiol. 67, 701–718 - PubMed

Publication types

MeSH terms

Substances