. 2015 Sep 11;349(6253):1228-32.
doi: 10.1126/science.aab3632. Epub 2015 Jul 30.

Viruses transfer the antiviral second messenger cGAMP between cells

Affiliations

Viruses transfer the antiviral second messenger cGAMP between cells

A Bridgeman et al. Science. .

Abstract

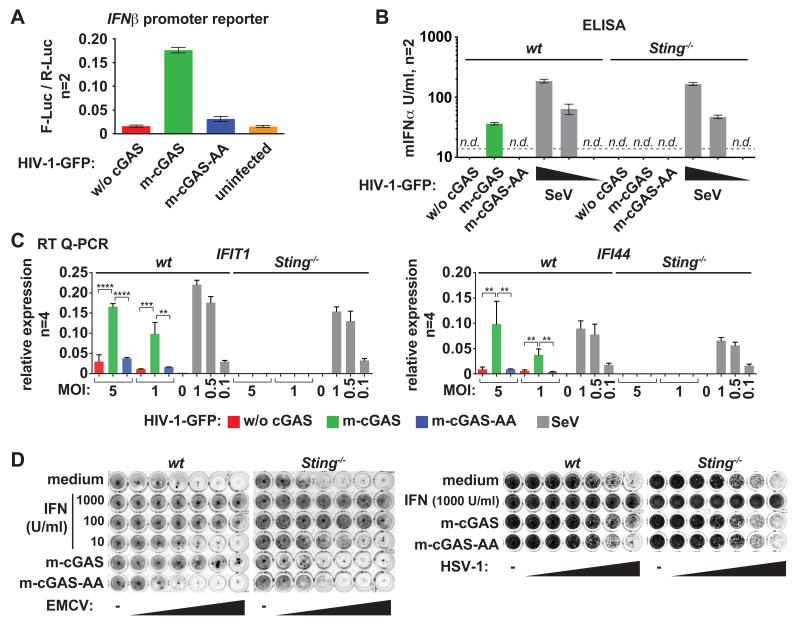
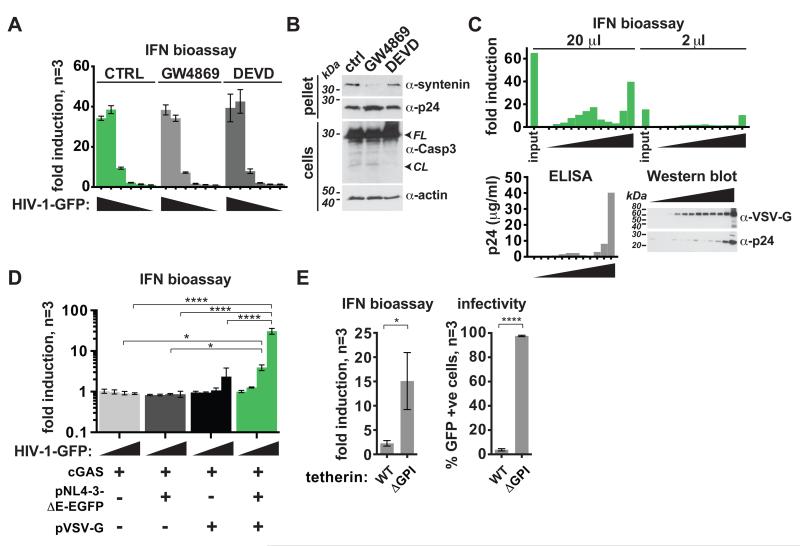
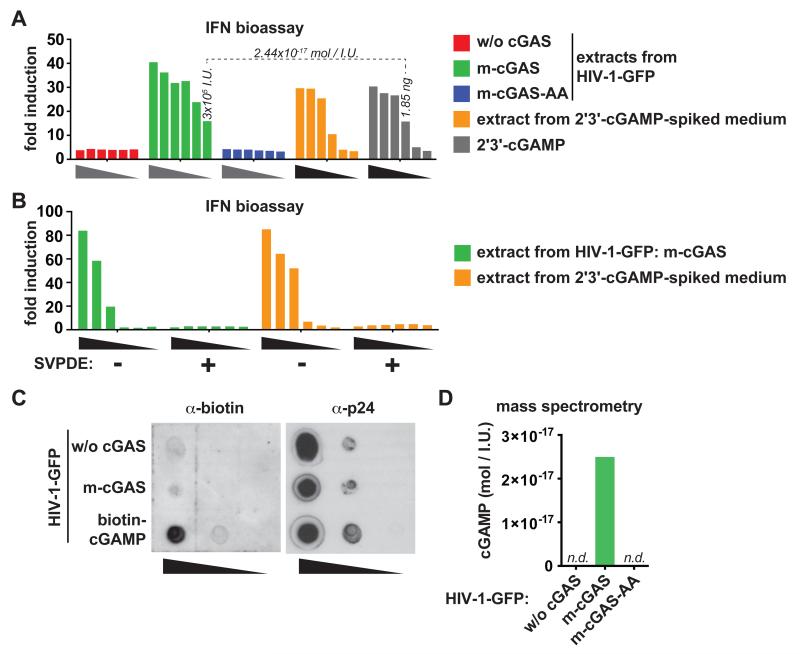
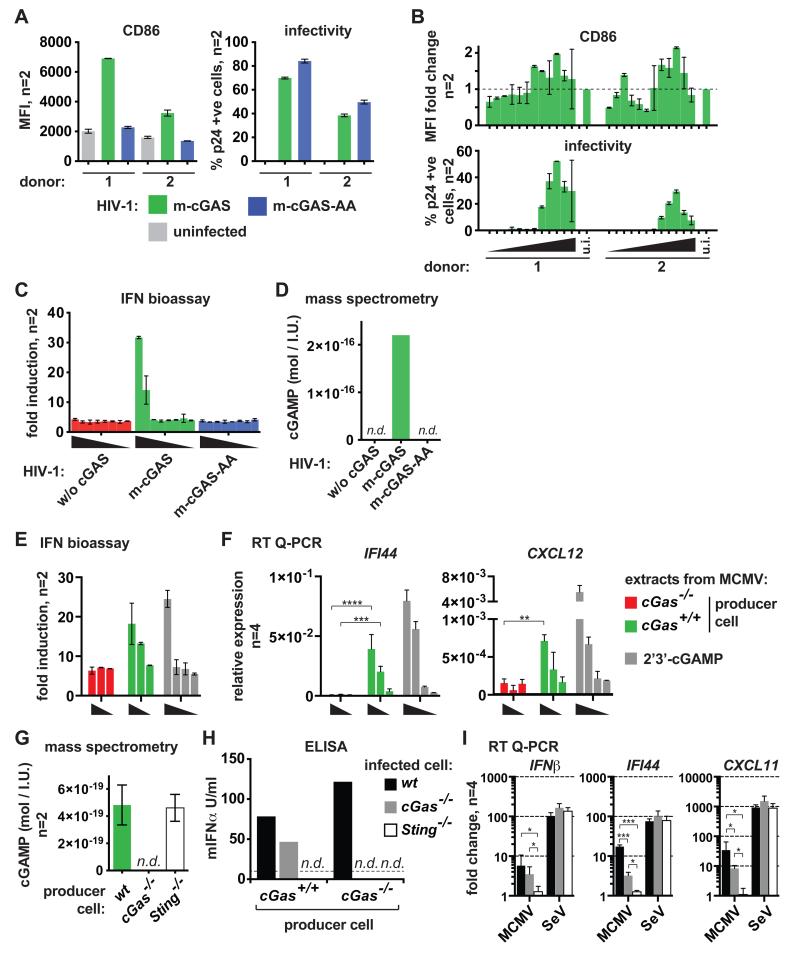
Cyclic GMP-AMP synthase (cGAS) detects cytosolic DNA during virus infection and induces an antiviral state. cGAS signals by synthesis of a second messenger, cyclic GMP-AMP (cGAMP), which activates stimulator of interferon genes (STING). We show that cGAMP is incorporated into viral particles, including lentivirus and herpesvirus virions, when these are produced in cGAS-expressing cells. Virions transferred cGAMP to newly infected cells and triggered a STING-dependent antiviral program. These effects were independent of exosomes and viral nucleic acids. Our results reveal a way by which a signal for innate immunity is transferred between cells, potentially accelerating and broadening antiviral responses. Moreover, infection of dendritic cells with cGAMP-loaded lentiviruses enhanced their activation. Loading viral vectors with cGAMP therefore holds promise for vaccine development.


Figures

Fig. 1
Fig. 1
HIV-1-GFP produced in cGAS-reconstituted 293T cells induces IFN. (A) HEK293 cells were transfected with p125-F-Luc (IFNβ promoter reporter) and pRL-TK. After 6-8 hours, cells were infected (MOI=1) with HIV-1-GFP from producer cells expressing cGAS as indicated. FLuc activity was analyzed after 24 hours and normalized to R-Luc. m-cGAS-AA is a catalytically inactive mutant (N=2 biological replicates, average and individual values are shown). (B) BMDMs of the indicated genotypes were infected with HIV-1-GFP (MOI=5) or SeV (wedges: MOI=1, 0.5, 0.1). Supernatant was tested after 24 hours for mIFNα by ELISA (n.d.: not detectable; dashed line: lower limit of detection, N=2 biological replicates, average and individual values are shown). (C) BMDMs were infected as in (B) and the indicated mRNAs were quantified relative to GAPDH mRNA by RT Q-PCR (N=4 replicates; error bars indicate SD and significance was determined by ANOVA; ****, P < 0.0001; ***, P < 0.001; **, P < 0.01; *, P < 0.05). (D) Lung fibroblasts were treated with IFN-A/D or infected with HIV-1-GFP (MOI=2). Cells were then infected with EMCV or HSV-1 (wedges: 4-fold dilutions starting at MOI=4 or MOI=64, respectively). After 24 hours, cells were stained with crystal violet. Data are representative of three or more independent experiments.
Fig. 2
Fig. 2
IFN induction triggered by HIV-1-GFP from cGAS expressing cells is mediated by virions. (A,C-E) HEK293 cells were infected for 24 hours, washed and after additional 48 hours, secreted IFN was analyzed by bioassay. (A) HIV-1-GFP was produced in cells reconstituted with m-cGAS that were also treated with 20 μM GW4869, 60 μM Ac-DEVD-CHO or were left untreated (control). Fresh cells were infected with pelleted virus (wedges: 10-fold dilutions, N=3 biological replicates). Differences between groups were not statistically significant (ANOVA). (B) Pelleted viruses from (A) (top) or whole cell extracts (bottom) from virus producer cells were tested by Western blot. FL denotes full length and CL cleaved caspase 3. (C) HIV-1-GFP from cGAS expressing cells was loaded onto density gradients. Wedges indicate increasing iodixanol concentration in 12 collected fractions. 20 and 2 μl of each fraction and of the input were tested. p24 concentrations were determined by ELISA (bottom left) and p24 and VSV-G were analyzed by Western blot (bottom right). (D) 293T cells were transfected as indicated to produce mock “virus” stocks (wedges: 10-fold dilutions, N=3 biological replicates). (E) Vpu-deficient lentivectors produced in cells expressing cGAS and either wild type or mutant tetherin were tested. The fraction of infected cells was determined by FACS (right). N=3 biological replicates. Error bars are ±SD and significance was determined by ANOVA (A,D) or unpaired t-test (E) (****, P < 0.0001; ***, P < 0.001; **, P < 0.01; *, P < 0.05). Data are representative of two (C) or three (A,B,D,E) independent experiments.
Fig. 3
Fig. 3
Small molecule extracts from HIV-1-GFP generated in cGAS-reconstituted producer cells induce IFN and contain cGAMP. (A) Extracts from viruses produced in the absence of cGAS or in the presence of wild-type (m-cGAS) or mutant cGAS (m-cGAS-AA) were added to digitonin permeabilized THP1 cells. IFN in THP1 supernatants was assessed by bioassay. Gray wedges represent a 1:2 dilution series starting with extract from 107 infectious units. As controls, synthetic 2′3′-cGAMP was either directly added to THP1 cells (grey bars) or was spiked into medium and then included in the extraction procedure (orange bars). Black wedges represent a 1:3 dilution series starting with 50 ng 2′3′-cGAMP. Extraction efficiency (Fig. S5B) was taken into account to estimate the amount of cGAMP per infectious unit (dotted line). (B) Extract from 107 infectious units HIV-1-GFP produced in the presence of cGAS was incubated with or without SVPDE for 1 hour and then added to digitonin permeabilized THP1 cells. IFN in THP1 supernatants was assessed by bioassay. Wedges represent a 1:3 dilution series. (C) HIV-1-GFP produced in the absence or presence of cGAS or in biotin-cGAMP transfected cells was probed by dot blot for biotin (left). The stripped membrane was re-probed for p24 (right). Wedges represent a 1:10 dilution series starting with 2×10⁶ infectious units. (D) cGAMP concentration in samples from (A) was analyzed by mass spectrometry. n.d., not detectable. Data are representative of two (B) or three (A,C,D) independent experiments.
Fig. 4
Fig. 4
Fully infectious HIV-1 and MCMV incorporate cGAMP. (A) hMDDCs from two blood donors were infected with HIV-1 produced in the presence of wild-type (m-cGAS) or mutant cGAS (m-cGAS-AA). CD86 and p24 expression were determined by FACS; MFI = mean fluorescence intensity (N=2 infections per donor, average and individual values are shown). (B) HIV-1 produced in the presence of wild-type cGAS was fractionated on density gradients and analyzed as in (A). CD86 MFI in uninfected (u.i.) cells was set to 1 (N=2 infections per donor, average and individual values are shown). (C) Extracts from HIV-1 were tested as in Fig. 3A. wedges = 3-fold dilutions (N=2 biological replicates, average and individual values are shown). (D) 2′3′-cGAMP concentration in samples from (C) was analyzed by mass spectrometry. n.d., not detectable. (E,F) MCMV was propagated in primary MEFs of the indicated genotypes. Virus extracts or 2′3′-cGAMP were added to permeabilized THP1 cells. Secreted IFN was assessed by bioassay (E, N=2 biological replicates, average and individual values are shown) and the indicated mRNAs were quantified by RT Q-PCR relative to GAPDH mRNA (F, N=4 replicates). Wedges represent a 1:3 dilution series starting with extract from 250,000 infectious units or 0.0686 ng cGAMP. (G) cGAMP concentrations in MCMV extracts were analyzed by mass spectrometry. n.d., not detectable. Data were pooled from two independent experiments. Average and individual values are shown. (H) BMDMs of the indicated genotypes were infected with MCMV (MOI=7) from cGas+/+ or cGas−/− MEFs and supernatant mIFNα was analyzed by ELISA after 20 hours (n.d., not detectable; dashed line: lower limit of detection). (I) BMDMs as in (H) were infected with MCMV (MOI=1) from cGas+/+ MEFs for 20 hours. The indicated mRNAs were quantified by RT Q-PCR relative to GAPDH mRNA and fold changes compared to mock infected cells were calculated (N=4 replicates). SeV was used as a control (MOI=0.5). In F and I error bars indicate SD and significance was determined by ANOVA (****, P < 0.0001; ***, P < 0.001; **, P < 0.01; *, P < 0.05). Data are representative of three (A) or two (B-F,I) independent experiments.

Comment in

References

    1. Samuel CE. Antiviral actions of interferons. Clin Microbiol Rev. 2001;14:778–809. - PMC - PubMed
    1. Pichlmair A, Reis e Sousa C. Innate recognition of viruses. Immunity. 2007;27:370–383. - PubMed
    1. Paludan SR, Bowie AG. Immune Sensing of DNA. Immunity. 2013;38:870–880. - PMC - PubMed
    1. Sun L, Wu J, Du F, Chen X, Chen ZJ. Cyclic GMP-AMP synthase is a cytosolic DNA sensor that activates the type I interferon pathway. Science. 2013;339:786–791. - PMC - PubMed
    1. Wu J, et al. Cyclic GMP-AMP is an endogenous second messenger in innate immune signaling by cytosolic DNA. Science. 2013;339:826–830. - PMC - PubMed

Publication types

MeSH terms

Substances