. 2015 Jul 31:8:26.
doi: 10.1186/s13072-015-0019-3. eCollection 2015.

The complex pattern of epigenomic variation between natural yeast strains at single-nucleosome resolution

Affiliations

The complex pattern of epigenomic variation between natural yeast strains at single-nucleosome resolution

Fabien Filleton et al. Epigenetics Chromatin. .

Abstract

Background: Epigenomic studies on humans and model species have revealed substantial inter-individual variation in histone modification profiles. However, the pattern of this variation has not been precisely characterized, particularly regarding which genomic features are enriched for variability and whether distinct histone marks co-vary synergistically. Yeast allows us to investigate intra-species variation at high resolution while avoiding other sources of variation, such as cell type or subtype.

Results: We profiled histone marks H3K4me3, H3K9ac, H3K14ac, H4K12ac and H3K4me1 in three unrelated wild strains of Saccharomyces cerevisiae at single-nucleosome resolution and analyzed inter-strain differences statistically. All five marks varied significantly at specific loci, but to different extents. The number of nucleosomes varying for a given mark between two strains ranged from 20 to several thousands; +1 nucleosomes were significantly less subject to variation. Genes with highly evolvable or responsive expression showed higher variability; however, the variation pattern could not be explained by known transcriptional differences between the strains. Synergistic variation of distinct marks was not systematic, with surprising differences between functionally related H3K9ac and H3K14ac. Interestingly, H3K14ac differences that persisted through transient hyperacetylation were supported by H3K4me3 differences, suggesting stabilization via cross talk.

Conclusions: Quantitative variation of histone marks among S. cerevisiae strains is abundant and complex. Its relation to functional characteristics is modular and seems modest, with partial association with gene expression divergences, differences between functionally related marks and partial co-variation between marks that may confer stability. Thus, the specific context of studies, such as which precise marks, individuals and genomic loci are investigated, is primordial in population epigenomics studies. The complexity found in this pilot survey in yeast suggests that high complexity can be anticipated among higher eukaryotes, including humans.

Keywords: Ecology; Epi-allele; Epi-polymorphism; Epigenomics; Evolution; Histone modification; Natural strains; Yeast.


Figures

Fig. 1
Fig. 1
Principal component analysis (PCA) of epigenomic variation. Each dot represents one experiment, with symbols indicating the antibodies that were used (if any) and colors indicating the strains. PCA was performed on genomic coverages by dividing the genome into 90 bp bins and counting the number (per million) of forward sequence reads covering each bin. a The first two components discriminate the nucleosomal marks (identical symbols are grouped). b The next two components discriminate the strains (identical colors are grouped).
Fig. 2
Fig. 2
Inter-strain distances according to five epigenomic marks. a Hierarchical clustering of strains. For each histone modification, the distance between two samples was determined as 1 − ρ, where ρ is the Spearman rank-based correlation coefficient between the profiles of the two samples. Profiles comprised ChIP counts computed at every nucleosome by NucleoMiner2.0 [44] (see “Methods”). bf ChIP coverage profiles of the indicated marks along an average gene (in per-million reads, normalized and averaged across replicates). Colors correspond to strains as in a. g Same representation but for MNase average profile. h H3K14 acetylation differences between the BY and RM strains, before and after the transient reprogramming described in [15]. The distribution of log2(RM/BY) of ChIP-CHIP intensities is shown for all nucleosomes (gray) and for the subset of nucleosomes (magenta) located in the second half of the body of 529 genes responsible for the specific pattern of RM. Magenta and gray distributions significantly differ (Kolmogorov–Smirnov p value <10−15) both before and after reprogramming. i Genomic QTL scan for regulators of the RM-specific K14ac profile in f. Red line significance threshold determined by permutations. Linkage score: −log10(P), where P is the nominal QTL p value.
Fig. 3
Fig. 3
Gene clustering according to BY–RM epigenomic divergence. For each gene, the ChIP/MNase log ratio in each strain was computed on genomic bins covering the gene body (from TSS to TES, orange box, divided in percentiles) together with 500 bp of their upstream and downstream regions. The difference in signal between the two strains was computed (black to red color scale). Genes were clustered by their similarity in this differential signal across the five chromatin marks. a Average pattern of the 23 clusters described in Table 1. b Details of three clusters with previously measured differential mRNA expression [33]. Cyan missing mRNA data. c Correlation between gene expression (y-axis) and histone modification (x-axis) variation. For each modification, inter-strain difference was computed as the mean of (log2(ChIP/Mnase) of strain 1 − log2(ChIP/Mnase) strain 2) from the TSS to the TES. Each plot corresponds to one histone modification compared between two strains, with dots representing genes. Only genes for which the mean log ratio was above zero in at least one strain were considered. Upper panels BY versus RM. Lower panels BY versus YJM. ρ Pearson correlation coefficient. Lines linear fits. d Same analysis as in c but for the expression of non-coding transcripts in BY and YJM [23].
Fig. 4
Fig. 4
Intra-species chromatin divergence of every gene. Genes were segmented in bins corresponding to percentiles of the gene body (from TSS to TES) plus 500 bp of the upstream and downstream regions. For every gene, the divergence was quantified from an ANOVA model and termed ‘epidiv’ (see “Methods”). a Examples of genes with low (0.35) and high (>100) epidiv values. The normalized ChIP/MNase profiles are colored according to strains. Black BY, red RM and green YJM. b Epidiv values as a function of DNA sequence divergence of every gene. c Epidiv values as a function of transcription responsiveness from [60]. The red line is a smoothed average, showing that the correlation is mainly supported by highly responsive genes. ρ Spearman correlation coefficient. P value: significance rank-based correlation test. d Epidiv values for genes with or without a TATA box [60]. P value: Wilcoxon Mann–Whitney test. Colored bar median.
Fig. 5
Fig. 5
Divergence in nucleosome positioning. Our nucleosome mapping method defined two types of nucleosomal regions: well-positioned nucleosomes and UNRs, which correspond to conserved and variable positioning across biological replicates, respectively. a Shift in dyad position between strains for matched well-positioned nucleosomes. Lines show the distribution of the shifts between two strains. This panel considers the well-positioned nucleosomes of both strains that could be reliably matched. b Positioning divergence of nucleosomes that are well positioned in BY, but did not match a well-positioned nucleosome of RM. For all such BY nucleosomes (gray ellipse), two measures were retrieved that reflect distance to the nearest UNR (red rectangle) and nearest well-positioned nucleosome (red ellipse) in RM. Cases of full overlap (>99%) with a UNR from RM are not displayed because they correspond to conserved occupancy between the two strains. The blue line distinguishes a subpopulation of BY nucleosomes (pink dots) whose positions differ in RM [poorly matching a well-positioned nucleosome of RM (high x-axis value) or incomplete overlap with a nucleosomal region of RM (low y-axis value)]. c Average genic location of nucleosomes with differential positioning. The distributions show the location of well-positioned BY nucleosomes along an average gene. Gray all. Pink subset of nucleosomes whose positions differ in RM (pink flagged nucleosomes in a, combined with pink flagged nucleosomes in b). The fraction of nucleosomes that are not shifted (orange smoothed line) reflects conservation. d Transcriptional divergence between BY and RM. X-axis: log2 ratio of mRNA levels (data from [33]). Y-axis: density of genes. Black all genes. Pink 411 genes containing at least one nucleosome with differential positioning (from c). Shoulders in the pink distribution indicate matches between differential positioning and differential expression. The mode at zero shows that, for most of these genes, differential positioning is not accompanied by differential expression.
Fig. 6
Fig. 6
Statistical detection of SNEPs. a Statistical tests applied to 39,961 matched well-positioned nucleosomes and UNRs (dots). The x-axis is the significance of a differential MNase-seq signal between the strains, which reflects different levels of nucleosome occupancy. The y-axis is the statistical significance of SNEP detection for H3K4me3, which corresponds to the null hypothesis of no interaction term in a generalized linear model implemented in DESeq (see “Methods” and [44]). Orange (black) dots correspond to nucleosomes for which the test was (was not) significant at the genome-wide level, respectively (FDR = 0.0001). Labels B, C and E indicate nucleosomes presented in the corresponding panels. b Count data for a nucleosome where an SNEP is detected. A differential H3K4me3 ChIP-seq value was observed, with no significant change in MNase-seq counts between the strains. c Count data for a nucleosome where an SNEP is detected, with differential MNase-seq values. Despite a lower abundance of the nucleosome in RM, the ChIP signal for this strain is comparable or even higher than that for BY. The trimethylation level therefore differs between strains after accounting for nucleosome abundance. d Coverage profile of the locus containing the SNEP presented in b. The figure was produced by prolonging the reads to a final length of 150 nucleotides and normalizing by the sample size factor (see “Methods”). Boxes below the profiles indicate six well-positioned nucleosomes (top BY, bottom RM), colored in violet for the one presented in b. x-axis: genomic coordinates (in nucleotides) on the BY genome. e Count data for a nucleosome where the differential ChIP signal is fully explained by differential occupancy. Variation at this nucleosome is therefore not an SNEP.
Fig. 7
Fig. 7
Regionality versus. precision of nucleosomal variation. a Analysis of BY/RM SNEPs. For each histone mark, regionality of variation was examined by counting, for each SNEP, the frequency of SNEPs on the ten upstream and ten downstream nucleosomes (black bars). Expected frequencies in the absence of regionality were estimated by re-assigning the SNEPs of this mark to random nucleosomes (red bars). Large black shoulders correspond to high regionality, where SNEPs tend to group together. Regionality of H3K4me3 remained when randomization was restricted to nucleosomes having above-background ChIP signal in at least one strain (Additional file 25, C). b SNEP frequency among +1, −1 and all other nucleosomes. Chi square test significance: **p value <10−6, *p value <0.01.
Fig. 8
Fig. 8
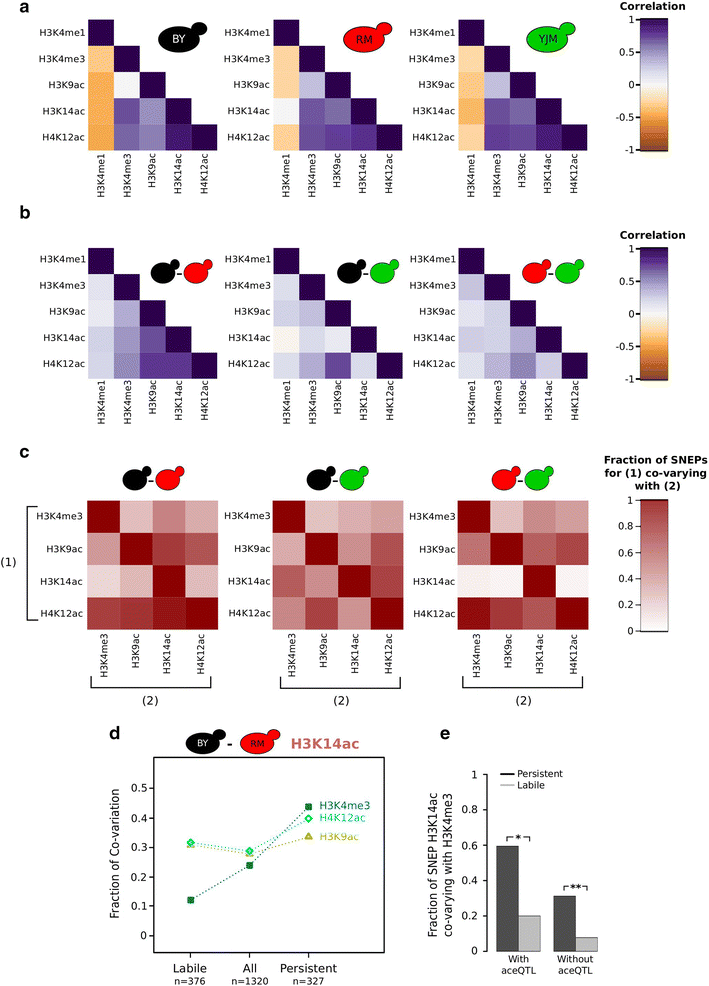
Co-variation of chromatin marks. a Correlation of epigenomic profiles in each strain. Colors represent Spearman coefficients of pairs of histone marks, computed on the genome-wide vectors of nucleosome-level ChIP/MNase signal. Low or negative correlations correspond to marks located on different nucleosomes. b Correlation between inter-strain difference in one histone mark and inter-strain difference in another mark. In each strain–strain comparison, the divergence of one mark was quantified on every nucleosome, while accounting for differential nucleosomal abundance (Fig. 6). Color Spearman correlation coefficient between such estimates of two histone marks, across all nucleosomes. c Fraction of SNEPs co-varying with another mark. For each strain pair, the set of nucleosomes harboring an SNEP of mark (1) was analyzed by counting how many showed significant divergence in mark (2) (at p value <0.01) in the same direction [higher level of mark (2) in the strain with higher level of mark (1)]. The p value corresponded to the nominal test used to detect SNEPs of mark (2). d Co-variation of specific H3K14ac SNEPs with other active marks. All ‘labile’ and ‘persistent’ SNEPs described in [15] were matched to nucleosomes of the current study and retained if matching was unambiguous and if H3K14ac SNEP significance in the current study verified p value <0.001. They were then analyzed by counting how many of them co-varied consistently with H3K9ac, H4K12ac, or H3K4me3 in the BY–RM comparison. e Co-variation with H3K4me3 is more frequent among persistent H3K14ac SNEPs than among labile H3K14ac SNEPs even when accounting for genetic control. The 327 persistent SNEPs (d) were split according to whether they were under the control of an aceQTL or not [15]. Stars indicate the significance of a Chi square test of independence at p = 0.012 (*) and p < 10−13 (**).

References

    1. Vaughn MW, Tanurd Ic M, Lippman Z, Jiang H, Carrasquillo R, Rabinowicz PD, et al. Epigenetic natural variation in Arabidopsis thaliana. PLoS Biol. 2007;5:e174. doi: 10.1371/journal.pbio.0050174. - DOI - PMC - PubMed
    1. Schilling E, Chartouni CE, Rehli M. Allele-specific DNA methylation in mouse strains is mainly determined by cis-acting sequences. Genome Res. 2009;19:2028–2035. doi: 10.1101/gr.095562.109. - DOI - PMC - PubMed
    1. Liu S, Sun K, Jiang T, Ho JP, Liu B, Feng J. Natural epigenetic variation in the female great roundleaf bat (Hipposideros armiger) populations. Mol Genet Genomics. 2012;287:643–650. doi: 10.1007/s00438-012-0704-x. - DOI - PubMed
    1. Zhang D, Cheng L, Badner JA, Chen C, Chen Q, Luo W, et al. Genetic control of individual differences in gene-specific methylation in human brain. Am J Hum Genet. 2010;86:411–419. doi: 10.1016/j.ajhg.2010.02.005. - DOI - PMC - PubMed
    1. Gibbs JR, van der Brug MP, Hernandez DG, Traynor BJ, Nalls MA, Lai SL, et al. Abundant quantitative trait loci exist for DNA methylation and gene expression in human brain. PLoS Genet. 2010;6:e1000952. doi: 10.1371/journal.pgen.1000952. - DOI - PMC - PubMed

LinkOut - more resources