Decreasing Proportion of Recent Infections among Newly Diagnosed HIV-1 Cases in Switzerland, 2008 to 2013 Based on Line-Immunoassay-Based Algorithms
- PMID: 26230082
- PMCID: PMC4521810
- DOI: 10.1371/journal.pone.0131828
Decreasing Proportion of Recent Infections among Newly Diagnosed HIV-1 Cases in Switzerland, 2008 to 2013 Based on Line-Immunoassay-Based Algorithms
Abstract
Background: HIV surveillance requires monitoring of new HIV diagnoses and differentiation of incident and older infections. In 2008, Switzerland implemented a system for monitoring incident HIV infections based on the results of a line immunoassay (Inno-Lia) mandatorily conducted for HIV confirmation and type differentiation (HIV-1, HIV-2) of all newly diagnosed patients. Based on this system, we assessed the proportion of incident HIV infection among newly diagnosed cases in Switzerland during 2008-2013.
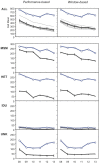
Methods and results: Inno-Lia antibody reaction patterns recorded in anonymous HIV notifications to the federal health authority were classified by 10 published algorithms into incident (up to 12 months) or older infections. Utilizing these data, annual incident infection estimates were obtained in two ways, (i) based on the diagnostic performance of the algorithms and utilizing the relationship 'incident = true incident + false incident', (ii) based on the window-periods of the algorithms and utilizing the relationship 'Prevalence = Incidence x Duration'. From 2008-2013, 3'851 HIV notifications were received. Adult HIV-1 infections amounted to 3'809 cases, and 3'636 of them (95.5%) contained Inno-Lia data. Incident infection totals calculated were similar for the performance- and window-based methods, amounting on average to 1'755 (95% confidence interval, 1588-1923) and 1'790 cases (95% CI, 1679-1900), respectively. More than half of these were among men who had sex with men. Both methods showed a continuous decline of annual incident infections 2008-2013, totaling -59.5% and -50.2%, respectively. The decline of incident infections continued even in 2012, when a 15% increase in HIV notifications had been observed. This increase was entirely due to older infections. Overall declines 2008-2013 were of similar extent among the major transmission groups.
Conclusions: Inno-Lia based incident HIV-1 infection surveillance proved useful and reliable. It represents a free, additional public health benefit of the use of this relatively costly test for HIV confirmation and type differentiation.
Conflict of interest statement
Figures


References
-
- Anonymous (2014) HIV and AIDS estimates (2012). UNAIDS.
-
- Anonymous (2014) HIV- und STI-Fallzahlen 2013: Berichterstattung, Analysen und Trends BAG Bulletin: 351–380.
-
- Janssen RS, Satten GA, Stramer SL, Rawal BD, O'Brien TR, Weiblen BJ, et al. (1998) New testing strategy to detect early HIV-1 infection for use in incidence estimates and for clinical and prevention purposes. Jama 280: 42–48. - PubMed
-
- Murphy G, Parry JV (2008) Assays for the detection of recent infections with human immunodeficiency virus type 1. Euro Surveill 13. - PubMed
-
- Le Vu S, Pillonel J, Semaille C, Bernillon P, Le Strat Y, Meyer L, et al. (2008) Principles and uses of HIV incidence estimation from recent infection testing—a review. Euro Surveill 13. - PubMed
Publication types
MeSH terms
Substances
LinkOut - more resources
Full Text Sources
Other Literature Sources
Medical

