. 2015 Jul 31;11(7):e1005413.
doi: 10.1371/journal.pgen.1005413. eCollection 2015 Jul.

A Year of Infection in the Intensive Care Unit: Prospective Whole Genome Sequencing of Bacterial Clinical Isolates Reveals Cryptic Transmissions and Novel Microbiota

Affiliations

A Year of Infection in the Intensive Care Unit: Prospective Whole Genome Sequencing of Bacterial Clinical Isolates Reveals Cryptic Transmissions and Novel Microbiota

David J Roach et al. PLoS Genet. .

Erratum in

Abstract

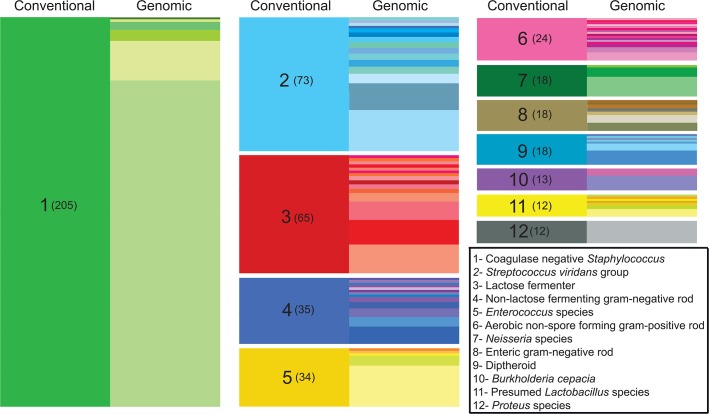
Bacterial whole genome sequencing holds promise as a disruptive technology in clinical microbiology, but it has not yet been applied systematically or comprehensively within a clinical context. Here, over the course of one year, we performed prospective collection and whole genome sequencing of nearly all bacterial isolates obtained from a tertiary care hospital's intensive care units (ICUs). This unbiased collection of 1,229 bacterial genomes from 391 patients enables detailed exploration of several features of clinical pathogens. A sizable fraction of isolates identified as clinically relevant corresponded to previously undescribed species: 12% of isolates assigned a species-level classification by conventional methods actually qualified as distinct, novel genomospecies on the basis of genomic similarity. Pan-genome analysis of the most frequently encountered pathogens in the collection revealed substantial variation in pan-genome size (1,420 to 20,432 genes) and the rate of gene discovery (1 to 152 genes per isolate sequenced). Surprisingly, although potential nosocomial transmission of actively surveilled pathogens was rare, 8.7% of isolates belonged to genomically related clonal lineages that were present among multiple patients, usually with overlapping hospital admissions, and were associated with clinically significant infection in 62% of patients from which they were recovered. Multi-patient clonal lineages were particularly evident in the neonatal care unit, where seven separate Staphylococcus epidermidis clonal lineages were identified, including one lineage associated with bacteremia in 5/9 neonates. Our study highlights key differences in the information made available by conventional microbiological practices versus whole genome sequencing, and motivates the further integration of microbial genome sequencing into routine clinical care.


Conflict of interest statement

The authors have declared that no competing interests exist.

Figures

Fig 1
Fig 1. Improved taxonomic resolution of bacterial typing by genomic similarity.
Data are shown for the 12 most frequent non-species-level classifications assigned by the clinical laboratory. These classifications encompassed 43% (527/1,229) of the isolates in our sample set, while isolates given a species-level classification by the clinical lab accounted for nearly 50% (612/1,229 isolates). On the left side of each column (“conventional”), colored blocks represent a classification assigned by the clinical microbiology laboratory based on phenotypic and/or biochemical characterization. The clinical classification and the number of isolates receiving the classification (in parentheses) are shown in the left column of each block. In the right side of each column (“genomic”), differently colored partitions indicate individual species-level assignments based on genomic similarity (closest identity to a representative of the species) for isolates of with the indicated clinical classification. The height of each colored partition in a column is proportional to the number of isolates it represents.
Fig 2
Fig 2. Clustering of sequenced isolates by genomic similarity.
(A) Network diagram of all 1,229 sequenced isolates that could be assigned to one of 78 clusters on the basis of pairwise ANIb. Each node represents an individual isolate, and is colored black if robustly matching a previously reported genome (≥ 95% ANIb) or white if corresponding to a novel genomospecies. Nodes connected by a visible edge indicate pairwise ANIb values ≥ 95%. Edges connecting isolates within the same cluster are colored according to that cluster, edges connecting isolates that match multiple clusters are grey. Clusters are labeled according to the most detailed taxonomic classification given to isolates during conventional identification. (B) Network diagram of 419 isolates corresponding to novel genomospecies, assigned to 53 clusters on the basis of pairwise ANIb. Clusters are labeled as in (A). For both panels, the length of edges between nodes is not informative or proportional to ANIb values, and consequently neither is the placement of specific nodes or groups within the graph. The amount of connectivity among nodes indicates the basis of their inclusion with respect to specific groups.
Fig 3
Fig 3. Pan-genome curves of the most abundant organisms recovered from clinical sampling.
(A) The total number of non-orthologous genes comprising the pan-genome, after excluding prophages and insertion sequences, for the 20 most prevalent organisms collected. Pan-genome size is shown for the indicated number of analyzed genomes. Plots are derived from organisms’ available reference genomes and the isolates sequenced in this study. Mean values are plotted for each estimate by a solid line, standard deviation for estimates are indicated by lightly shaded regions. (B) Pan-genome size calculated only from existing reference genomes, and after incorporation of all isolates sequenced. (C) Current rate of gene discovery, considering reference genomes and newly sequenced clinical strains.
Fig 4
Fig 4. Clonal lineages extending across multiple patients.
Clonal lineages are stratified by the indicated organisms. The x-axis indicates the timeline of this study, with day 0 corresponding to the first day of sample collection. Infection events in specific patients are represented by individual rows, with the length of the bar indicating the dates of a patient’s hospitalization. Bars are colored and grouped according to clonal lineages, and red arrowheads denote specimen collections where an isolate in the clonal lineage was obtained. The patient number and the hospital ward where the patient was receiving treatment when culture was performed is shown at the left (ICU legend below), and stars denote isolates that were associated with clinically significant infection (infections therapeutically targeted by physicians).

References

    1. Council NI (2000) National Intelligence Estimate 99-17D: The Global Infectious Disease Threat and Its Implications for the United States. - PubMed
    1. Anevlavis S, Bouros D (2010) Community acquired bacterial pneumonia. Expert Opin Pharmacother 11: 361–374. 10.1517/14656560903508770 - DOI - PubMed
    1. File TM Jr. (2004) Streptococcus pneumoniae and community-acquired pneumonia: a cause for concern. Am J Med 117 Suppl 3A: 39S–50S. - PMC - PubMed
    1. Stone PW (2009) Economic burden of healthcare-associated infections: an American perspective. Expert Rev Pharmacoecon Outcomes Res 9: 417–422. 10.1586/erp.09.53 - DOI - PMC - PubMed
    1. Klevens RM, Edwards JR, Richards CL Jr., Horan TC, Gaynes RP, et al. (2007) Estimating health care-associated infections and deaths in U.S. hospitals, 2002. Public Health Rep 122: 160–166. - PMC - PubMed

MeSH terms

Associated data