

Genetic Signatures of Demographic Changes in an Avian Top Predator during the Last Century: Bottlenecks and Expansions of the Eurasian Eagle Owl in the Iberian Peninsula
- PMID: 26230922
- PMCID: PMC4521928
- DOI: 10.1371/journal.pone.0133954
Genetic Signatures of Demographic Changes in an Avian Top Predator during the Last Century: Bottlenecks and Expansions of the Eurasian Eagle Owl in the Iberian Peninsula
Abstract
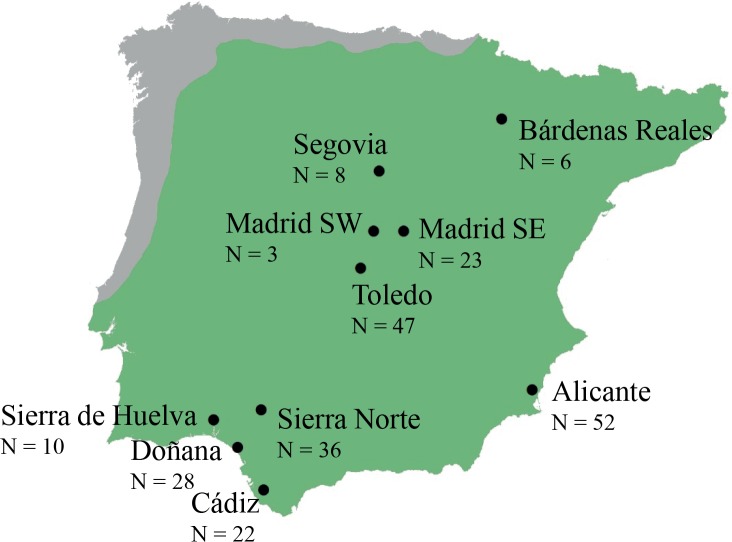
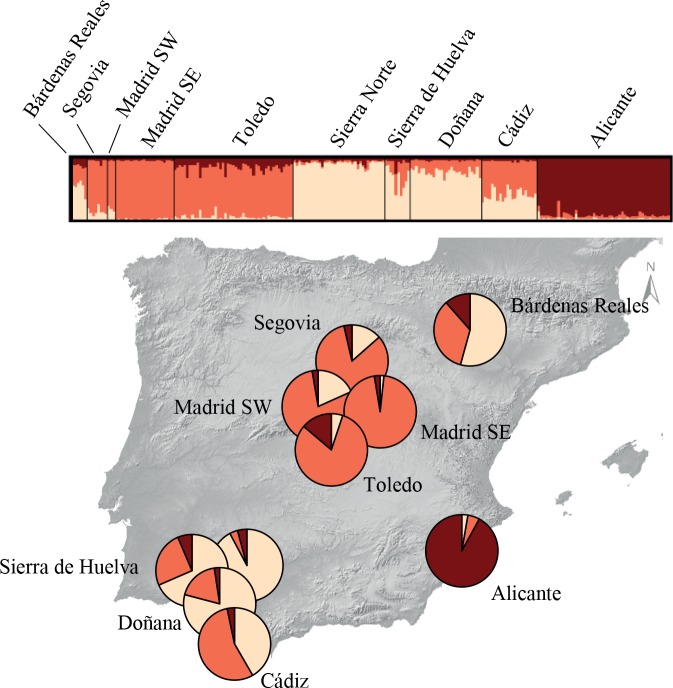
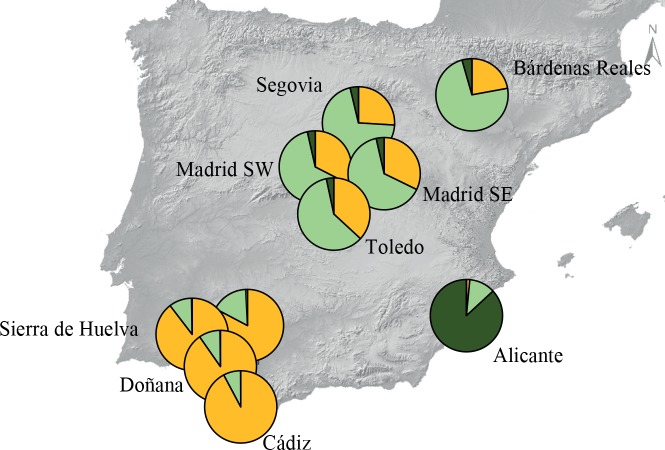
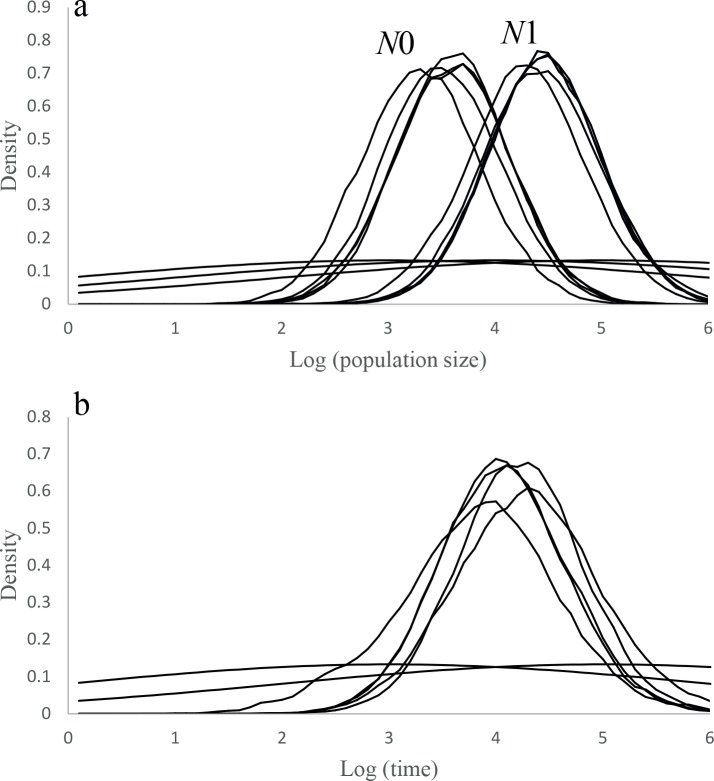
The study of the demographic history of species can help to understand the negative impact of recent population declines in organisms of conservation concern. Here, we use neutral molecular markers to explore the genetic consequences of the recent population decline and posterior recovery of the Eurasian eagle owl (Bubo bubo) in the Iberian Peninsula. During the last century, the species was the object of extermination programs, suffering direct persecution by hunters until the 70's. Moreover, during the last decades the eagle owl was severely impacted by increased mortality due to electrocution and the decline of its main prey species, the European rabbit (Oryctolagus cuniculus). In recent times, the decrease of direct persecution and the implementation of some conservation schemes have allowed the species' demographic recovery. Yet, it remains unknown to which extent the past population decline and the later expansion have influenced the current species' pattern of genetic diversity. We used eight microsatellite markers to genotype 235 eagle owls from ten Spanish subpopulations and analyse the presence of genetic signatures attributable to the recent population fluctuations experienced by the species. We found moderate levels of differentiation among the studied subpopulations and Bayesian analyses revealed the existence of three genetic clusters that grouped subpopulations from central, south-western and south-eastern Spain. The observed genetic structure could have resulted from recent human-induced population fragmentation, a patchy distribution of prey populations and/or the philopatric behaviour and habitat selection of the species. We detected an old population bottleneck, which occurred approximately 10,000 years ago, and significant signatures of recent demographic expansions. However, we did not find genetic signatures for a recent bottleneck, which may indicate that population declines were not severe enough to leave detectable signals on the species genetic makeup or that such signals have been eroded by the rapid demographic recovery experienced by the species in recent years.
Conflict of interest statement
Figures
Similar articles
-
Five ixodid tick species including two morphotypes of Rhipicephalus turanicus on nestlings of Eurasian eagle owl (Bubo bubo) from south-eastern Bulgaria.Parasit Vectors. 2021 Jun 26;14(1):334. doi: 10.1186/s13071-021-04832-0. Parasit Vectors. 2021. PMID: 34174951 Free PMC article.
-
Superpredation increases mercury levels in a generalist top predator, the eagle owl.Ecotoxicology. 2011 Jun;20(4):635-42. doi: 10.1007/s10646-011-0603-7. Epub 2011 Feb 5. Ecotoxicology. 2011. PMID: 21298339
-
Temporal changes of genetic population structure and diversity in the endangered Blakiston's fish owl (Bubo blakistoni) on Hokkaido Island, Japan, revealed by microsatellite analysis.Zoolog Sci. 2012 May;29(5):299-304. doi: 10.2108/zsj.29.299. Zoolog Sci. 2012. PMID: 22559963
-
Key role of European rabbits in the conservation of the Western Mediterranean basin hotspot.Conserv Biol. 2008 Oct;22(5):1106-17. doi: 10.1111/j.1523-1739.2008.00993.x. Epub 2008 Jul 29. Conserv Biol. 2008. PMID: 18680504 Review.
-
Birds of prey as limiting factors of gamebird populations in Europe: a review.Biol Rev Camb Philos Soc. 2005 May;80(2):171-203. doi: 10.1017/s146479310400658x. Biol Rev Camb Philos Soc. 2005. PMID: 15921048 Review.
Cited by
-
Fine-scale genetic structure in the critically endangered red-fronted macaw in the absence of geographic and ecological barriers.Sci Rep. 2021 Jan 12;11(1):556. doi: 10.1038/s41598-020-79575-6. Sci Rep. 2021. PMID: 33436676 Free PMC article.
-
Dynamic range expansion leads to establishment of a new, genetically distinct wolf population in Central Europe.Sci Rep. 2019 Dec 12;9(1):19003. doi: 10.1038/s41598-019-55273-w. Sci Rep. 2019. PMID: 31831858 Free PMC article.
-
Localizing and Classifying Adaptive Targets with Trend Filtered Regression.Mol Biol Evol. 2019 Feb 1;36(2):252-270. doi: 10.1093/molbev/msy205. Mol Biol Evol. 2019. PMID: 30398642 Free PMC article.
References
-
- Saunders DA, Hobbs RJ, Margulis CR. Biological consequences of ecosystem fragmentation: a review. Conserv Biol. 1991; 5: 18–32.
-
- Wiens JA. Habitat fragmentation: island v landscape perspectives on bird conservation. Ibis. 2008; 137: S97–S104.
-
- Moilanen A, Hanski I. Metapopulation dynamics: Effects of habitat quality and landscape structure. Ecology. 1998; 79: 2503–2515.
-
- Graham K, Beckerman AP, Thirgood S. Human-predator-prey conflicts: ecological correlates, prey losses and patterns of management. Biol Conserv. 2005; 122: 159–171.
Publication types
MeSH terms
LinkOut - more resources
Full Text Sources
Other Literature Sources
Miscellaneous
