. 2015 Aug 7;6(22):19228-45.
doi: 10.18632/oncotarget.4653.

The presence of wild type p53 in hematological cancers improves the efficacy of combinational therapy targeting metabolism

Affiliations

The presence of wild type p53 in hematological cancers improves the efficacy of combinational therapy targeting metabolism

Nerea Allende-Vega et al. Oncotarget. .

Abstract

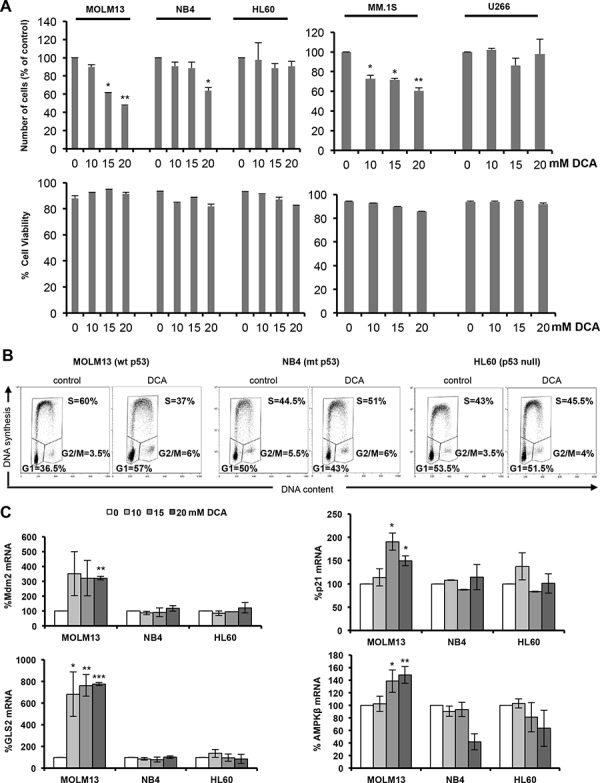
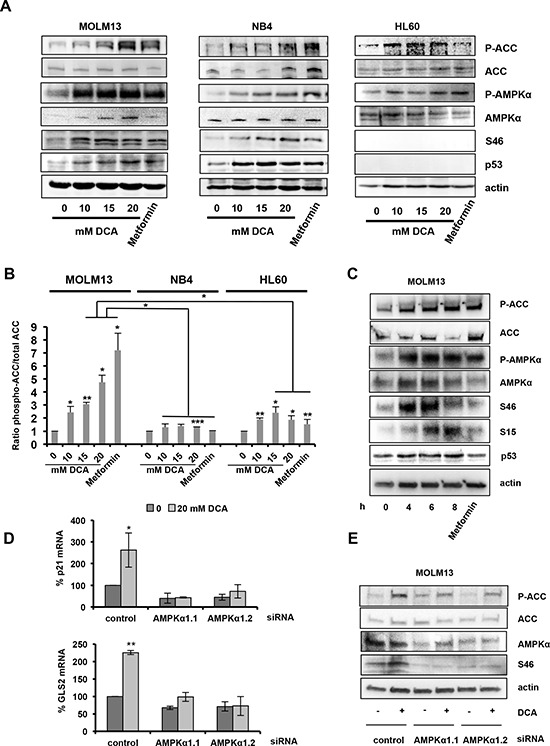
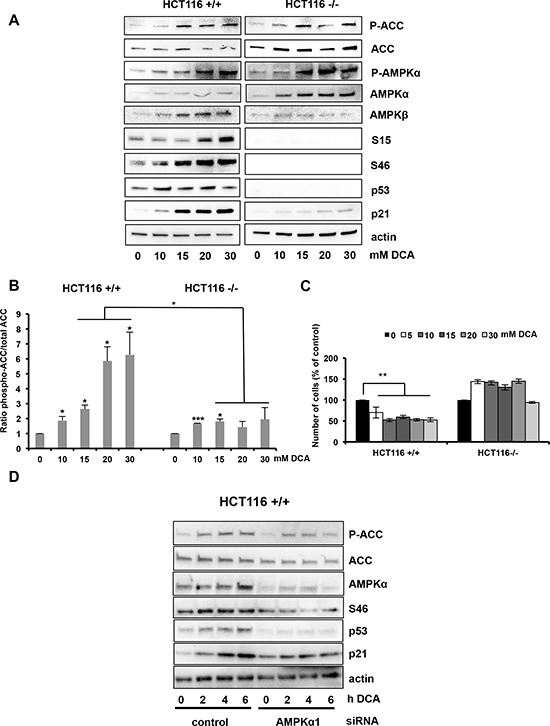
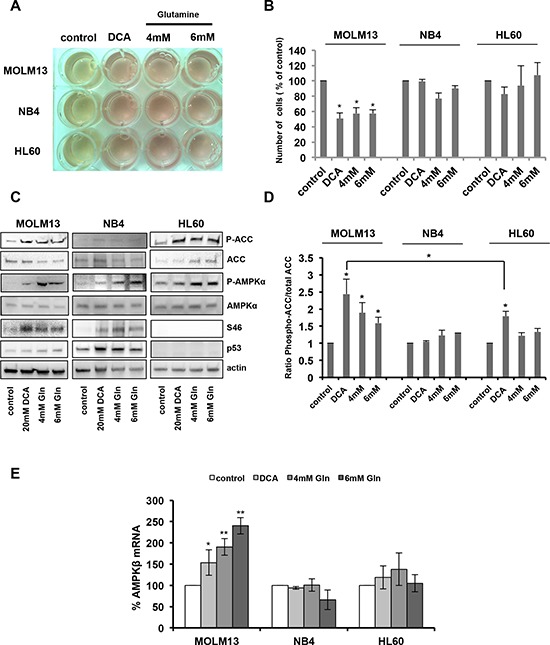
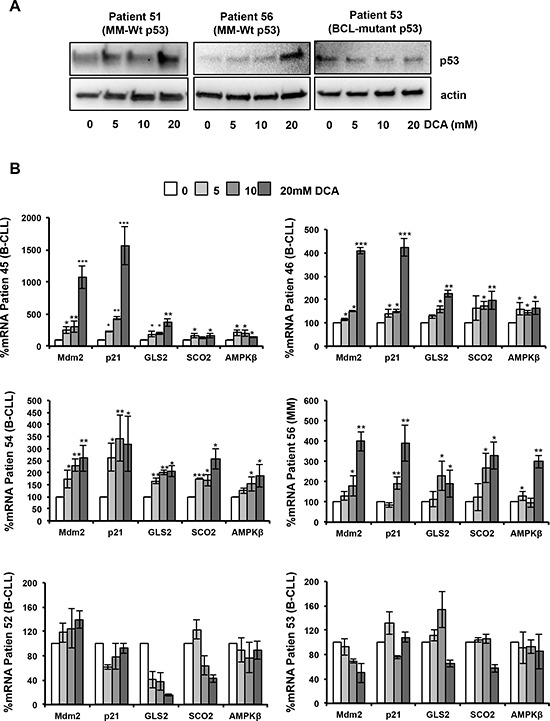
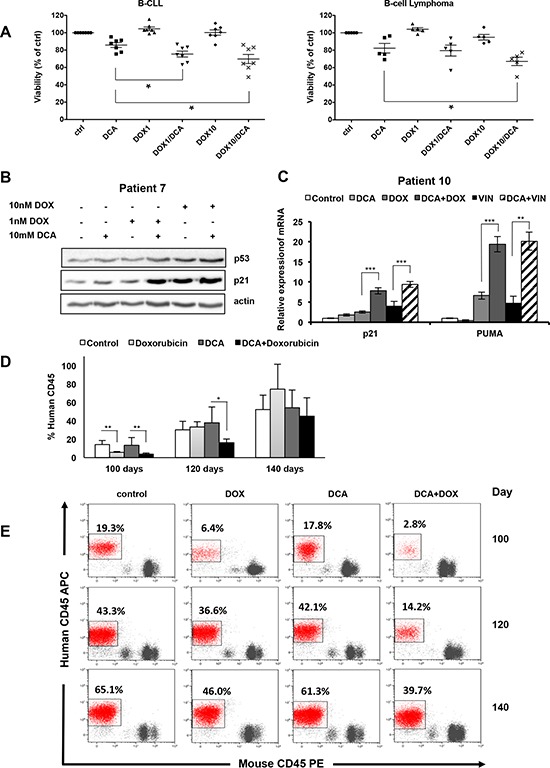
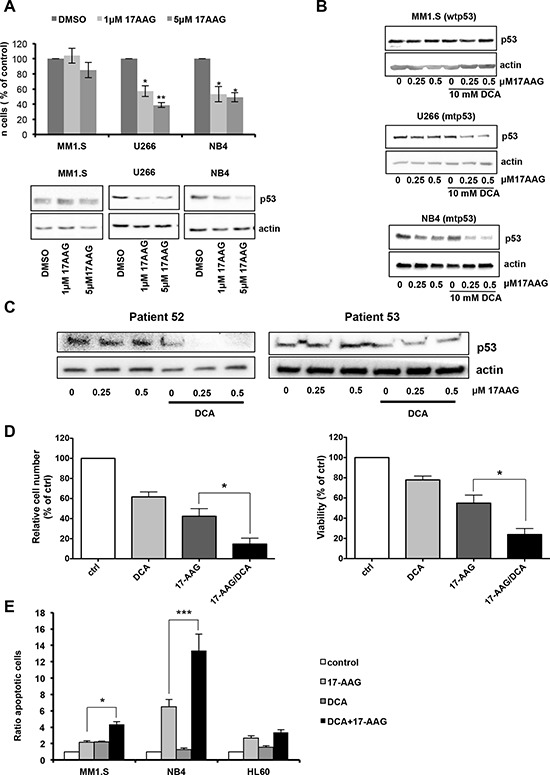
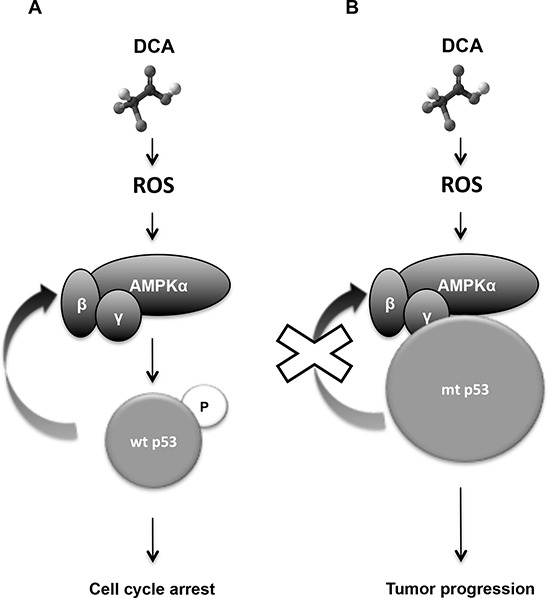
Manipulation of metabolic pathways in hematological cancers has therapeutic potential. Here, we determined the molecular mechanism of action of the metabolic modulator dichloroacetate (DCA) in leukemic cells. We found that DCA induces the AMP-activated protein kinase (AMPK)/p53 pathway with increased efficacy in tumors expressing wild type (wt p53). Clinically relevant, low concentrations of doxorubicin synergize in vitro and in vivo with DCA to further enhance p53 activation and to block tumor progression. Leukemia cell lines and primary leukemic cells containing mutant p53 are resistant to the above-described combination approach. However, DCA synergized with the Hsp90 inhibitor 17-AAG to specifically eliminate these cells. Our studies strongly indicate that depending on the p53 status, different combination therapies would provide better treatment with decreased side effects in hematological cancers.

Keywords: AMPK; dichloroacetate; metabolism; mutant p53; oxidative phosphorylation.


Conflict of interest statement

CONFLICTS OF INTEREST

The authors have filed one patent application EP12305583.2, but declare that they do not have other competing financial or other interests.

Figures

Figure 1
Figure 1. DCA activates p53 and causes p53-dependent cell cycle arrest
A. AML (MOLM13, NB4 and HL60) and MM (MM1.S and U266) cells were incubated with the indicated concentration of DCA for 48 h and then cell viability and alive cell numbers were determined using the Muse® Cell Analyzer. Data are means ± SEM of two independent experiments B. DCA causes G1 cell cycle arrest in leukemic cells harboring wt p53. MOLM13 (wt p53), NB4 (mutant p53) and HL60 (p53−/−) cells were cultured in the presence of 20 mM DCA for 48 h. Cells were then pulse-labeled with EdU and harvested for cell cycle distribution analysis (wt, wild type; mt, mutant). C. mRNA levels of the p53 target genes MDM2, p21, GLS2 and AMPKβ. Values are the mean ± SEM of results from two independent experiments performed in triplicate in cells incubated with the indicated DCA concentrations for 24 h.
Figure 2
Figure 2. DCA-mediated activation of the AMPK pathway is required for p53 induction
A. AML cells were incubated with the indicated concentrations of DCA or 5 mM metformin for 24 hr. DCA increases the phosphorylation levels of ACC (at Ser79), AMPKα (at Thr172) and p53 (at Ser46). B. Graph representing the ratio between phosphorylated ACC and total ACC protein levels. Bands were quantified using the Image lab software from two independent experiments. C. Time-course analysis by western blotting of the effect of 20 mM DCA in MOLM13 cells, including p53 phosphorylation on Ser15 and Ser46. D. AMPKα1 silencing with two different siRNAs attenuates DCA-induced p53 transcriptional activity in MOLM13 cells. Quantitative RT-PCR analysis of p21 and GLS2 mRNA levels (values are the mean ± SEM of two independent experiments performed in triplicate). E. AMPKα1 silencing decreases DCA-induced phosphorylation of ACC (Ser79) and p53 (Ser46). See also Supplementary Figure S2.
Figure 3
Figure 3. Activation of the AMPK/p53 pathway by DCA in HCT116 cells
A. Western blot analysis shows the protein levels of phosphorylated ACC, phosphorylated AMPKα, phosphorylated p53 (Ser15 and Ser46), total AMPKα, AMPKβ, p53 and p21 in p53+/+ and p53−/− HCT116 isogenic cells after incubation with DCA at the indicated concentrations for 24 h. B. Quantification of ACC phosphorylation from the western blot experiments from two independent experiments. C. HCT116 cells were incubated with increasing concentrations of DCA for 48 h and then the number of cells was evaluated by using the Muse® Cell Analyzer. Data are means ± SEM of two independent experiments D. AMPKα1 silencing inhibits p53 accumulation and phosphorylation in response to DCA. p53+/+ HCT116 cells were transfected with control siRNA and the siRNA against AMPKα1. 72 h later they were incubated or not with 20 mM DCA for 2, 4 and 6 hours and then protein expression was analyzed by western blotting.
Figure 4
Figure 4. Oxidative phosphorylation activates AMPK and the p53 pathway
A. AML cell lines were cultured in the presence of 20 mM DCA or in OXPHOS medium (4 mM Gln or 6 mM Gln) for 24 h. The yellow color of the medium indicates lactic acid production. B. Growth inhibition of MOLM13 cells incubated with 20 mM DCA or grown in OXPHOS medium (data are means ± SEM of two independent experiments). C. Western blotting showing the phosphorylation of ACC, AMPKα and p53 (Ser46) in AML cells grown in OXPHOS medium or in the presence of 20 mM DCA for 24 h. D. Quantification of the results from two independent experiments. E. RT-qPCR analysis of AMPKβ expression (values are the mean ± SEM of two independent experiments performed in triplicate) in cells treated as in (C).
Figure 5
Figure 5. DCA activates the p53 pathway in primary leukemic cells
A. Accumulation of p53 protein following 24-hour incubation with DCA in tumor cells from patients with MM (Patient 51, Patient 56) harboring wt p53. As control, tumor cells from a patient with BCL carrying mutant p53 are shown. B. DCA increases AMPKβ, Mdm2, p21, GLS2 and SCO2 mRNA expression in BCL and MM cells with wt p53 (Patients 45, 46, 54 and 56) after 24 h of treatment, but not in B-CLL cells harboring mutant p53 (Patient 52, Patient 53); *p < 0.05; **p < 0.01; ***p < 0.001. Values are the mean ± SEM from two set of experiments performed in triplicate.
Figure 6
Figure 6. Synergistic anti-proliferating effect of DCA in combination with doxorubicin in primary leukemic cells
A. Tumor cells from seven patients with B-CLL and five patients with B-cell lymphoma (all wt p53) were incubated with 10 mM DCA alone or in combination with doxorubicin (1 or 10nM; DOX) for 72 h. Tumor cells were identified (CD19+/CD20+) by flow cytometry and tumor cell death was quantified by 7-AAD staining using the Muse® Cell analyzer (values are the mean ± SEM from one experiment performed in triplicate *p < 0.05). B. Tumor cells (wt p53) from a patient with B-CLL (Patient 7) were treated with 10 mM DCA alone or in combination with doxorubicin (DOX) for 24 h. p53 and p21 expression was assessed by western blotting. C. mRNA levels of p21 and PUMA in primary tumor cells from a patient with MDS (wt p53; Patient 10) following incubation or not with 10 mM DCA for 24 h and then addition or not of 10 nM doxorubicin (DOX) or 10 nM vincristine (VIN) for another 24 h before analysis by RT-qPCR; **p < 0.01; ***p < 0.001. See also Supplementary Figure S6 (values are the mean ± SEM from one experiment performed in triplicate). D. NSG mice were engrafted with primary human AML cells (wt p53). At day 80 post-graft, they were treated with doxorubicin (n = 4), DCA (n = 4) or both (n = 4) and the percentage of human cells in peripheral blood samples was measured every 20 days; *p < 0.05; **p < 0.01 (values are expressed as median ± SEM). E. Representative plots of the percentage of human tumor cells in peripheral blood samples of mice at day 100, 120 and 140 post-graft.
Figure 7
Figure 7. DCA and 17-AAG synergize to induce apoptosis in mutant p53 tumor cells
A. Effect of 17-AAG in human leukemia cells with different p53 status. MM1.S (wt p53), U266 and NB4 (mutant p53) cells were incubated with 1 μM or 5 μM 17AAG for 24 h. Alive cell number was determined by Trypan blue exclusion. p53 protein levels were analyzed by western blot analysis. Data are means ± SEM of two independent experiments B. The combination of DCA and 17-AAG further decreases p53 protein expression in mutant p53 leukemic cell lines. Cells were treated with the different drugs for 24 h before protein expression analysis by western blotting. C. Decrease of p53 protein levels in primary tumor cells harboring mutant p53 after co-treatment with DCA and 17-AAG for 24 h. D. Effect of DCA alone or in combination with 17-AGG on viability of primary tumor cells. Tumor cells carrying mutant p53 from four different patients with B-CLL were treated with 10 mM DCA and/or 0.5 μM 17-AAG for 72 h. Cells were then stained (CD19+/CD20+ and 7-AAD) and analyzed by flow cytometry. Living tumor cells were counted using the Muse® Cell analyzer. The mutant p53 status was confirmed by sequencing. Data are means ± SEM of one experiment from four patients performed in triplicate E. DCA synergizes with 17-AAG to induce apoptosis mainly in leukemic cell lines that contain mutant p53. Cells were incubated with 10 mM DCA and/or 0.5 μM 17-AAG for 24 h and apoptosis was evaluated by Annexin V assay. Data are means ± SEM of two independent experiments.
Figure 8
Figure 8. Diagram describing the mechanism of how DCA efficacy depends on p53 status
A. DCA activates AMPK/p53 pathway in response to oxidative stress. Wt p53 is phosphorylated and transcriptional activated by AMPKα leading to G1 cell cycle arrest and inhibition of glycolysis. p53 also increases AMPKβ gene expression, reinforcing the AMP-activated protein kinase (AMPK) response. B. DCA doesn't stop proliferation in absence of p53 or presence or mtp53. mtp53 gain of functions could be involved in tumour progression, drug resistance and inhibition of certain genes such as AMPK.

References

    1. Villalba M, Lopez-Royuela N, Krzywinska E, Rathore MG, Hipskind RA, Haouas H, Allende-Vega N. Chemical metabolic inhibitors for the treatment of blood-borne cancers. Anticancer Agents Med Chem. 2014;14:223–232. - PMC - PubMed
    1. Warburg O. On respiratory impairment in cancer cells. Science. 1956;124:269–270. - PubMed
    1. Villalba M, Rathore MG, Lopez-Royuela N, Krzywinska E, Garaude J, Allende-Vega N. From tumor cell metabolism to tumor immune escape. Int J Biochem Cell Biol. 2013;45:106–113. - PubMed
    1. Boag JM, Beesley AH, Firth MJ, Freitas JR, Ford J, Hoffmann K, Cummings AJ, de Klerk NH, Kees UR. Altered glucose metabolism in childhood pre-B acute lymphoblastic leukaemia. Leukemia. 2006;20:1731–1737. - PubMed
    1. Samudio I, Fiegl M, McQueen T, Clise-Dwyer K, Andreeff M. The warburg effect in leukemia-stroma cocultures is mediated by mitochondrial uncoupling associated with uncoupling protein 2 activation. Cancer Res. 2008;68:5198–5205. - PMC - PubMed

Publication types

MeSH terms