. 2015 Aug 18;43(2):277-88.
doi: 10.1016/j.immuni.2015.07.009. Epub 2015 Jul 28.

Protein Tyrosine Phosphatase PTPRS Is an Inhibitory Receptor on Human and Murine Plasmacytoid Dendritic Cells

Affiliations

Protein Tyrosine Phosphatase PTPRS Is an Inhibitory Receptor on Human and Murine Plasmacytoid Dendritic Cells

Anna Bunin et al. Immunity. .

Abstract

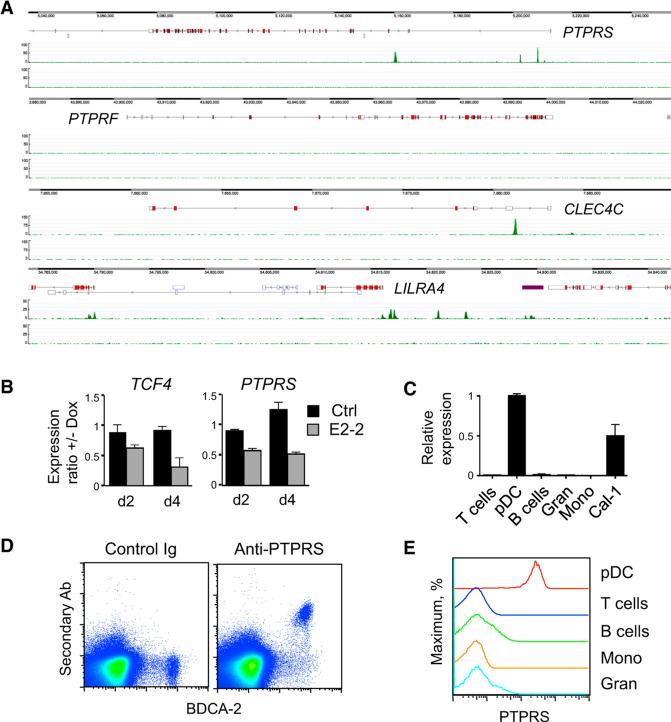
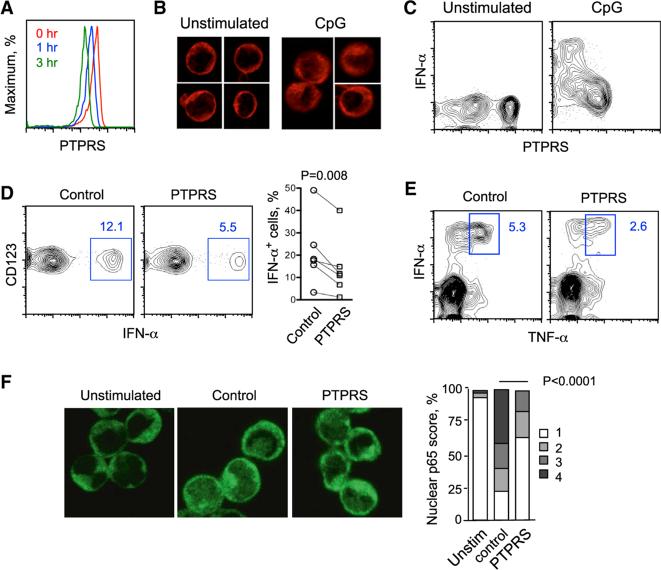
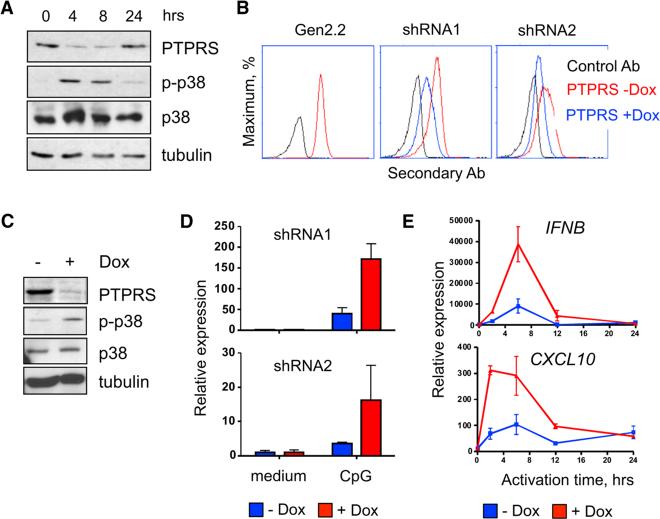
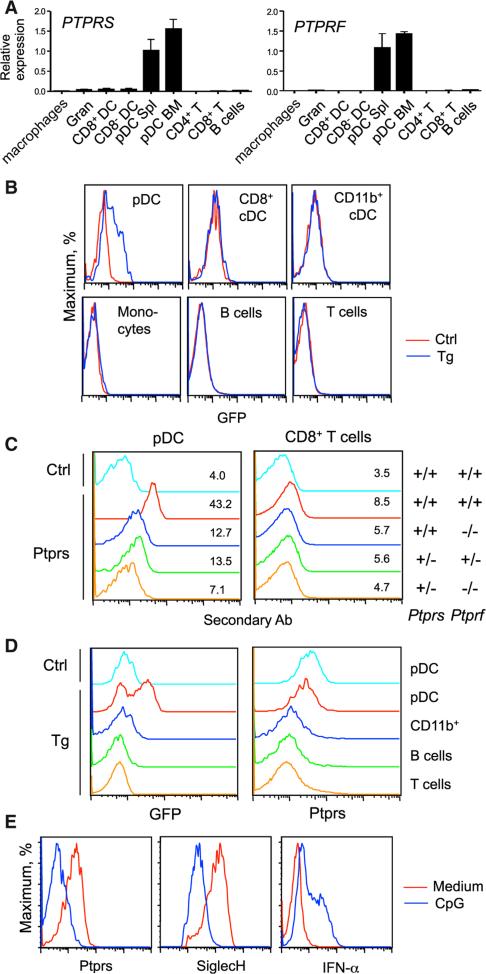
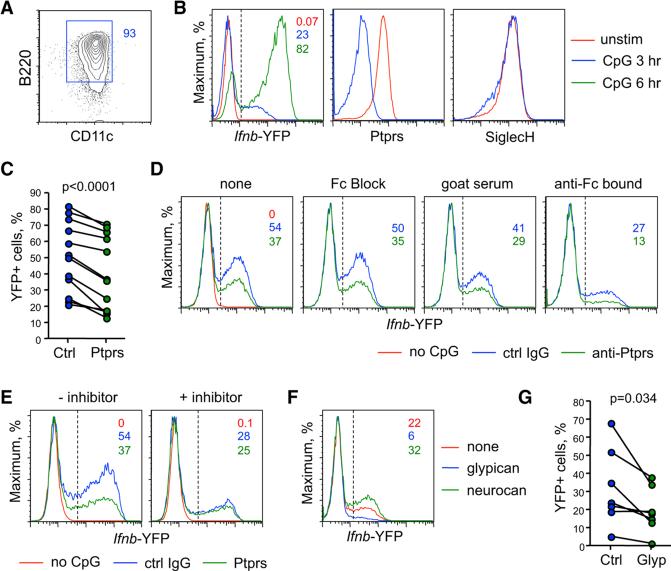
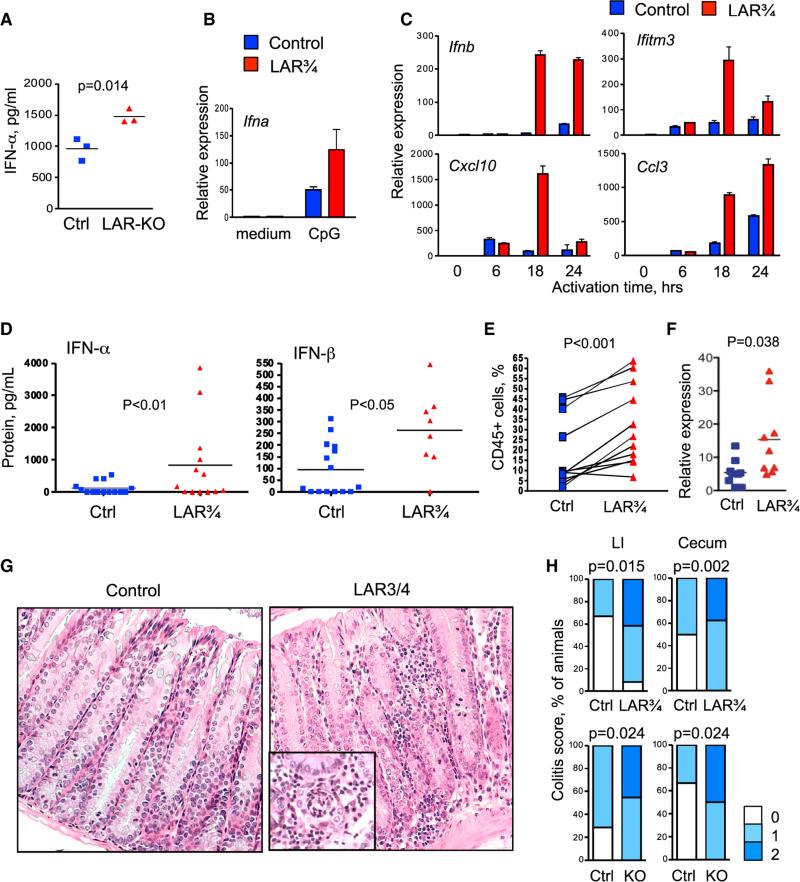
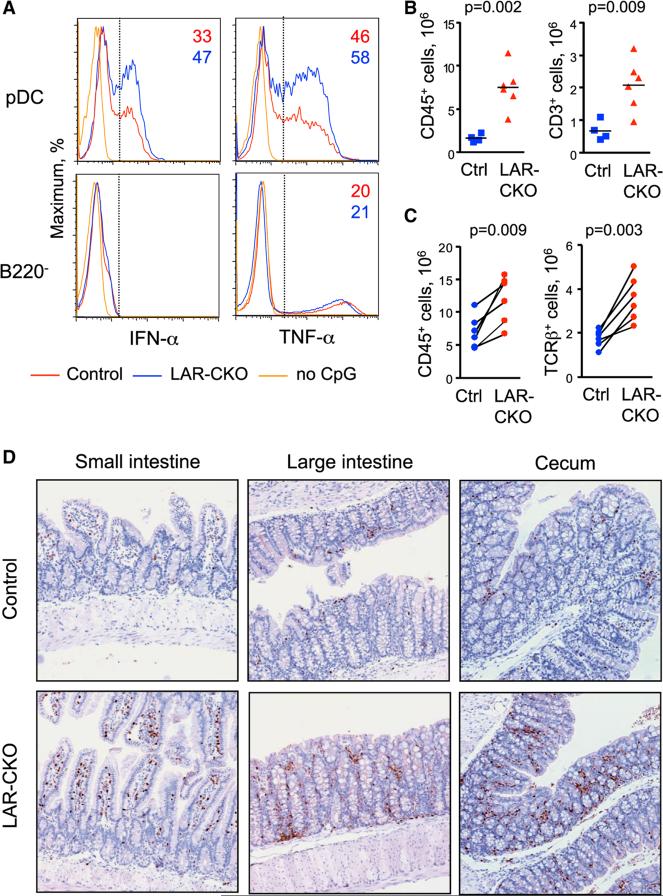
Plasmacytoid dendritic cells (pDCs) are primary producers of type I interferon (IFN) in response to viruses. The IFN-producing capacity of pDCs is regulated by specific inhibitory receptors, yet none of the known receptors are conserved in evolution. We report that within the human immune system, receptor protein tyrosine phosphatase sigma (PTPRS) is expressed specifically on pDCs. Surface PTPRS was rapidly downregulated after pDC activation, and only PTPRS(-) pDCs produced IFN-α. Antibody-mediated PTPRS crosslinking inhibited pDC activation, whereas PTPRS knockdown enhanced IFN response in a pDC cell line. Similarly, murine Ptprs and the homologous receptor phosphatase Ptprf were specifically co-expressed in murine pDCs. Haplodeficiency or DC-specific deletion of Ptprs on Ptprf-deficient background were associated with enhanced IFN response of pDCs, leukocyte infiltration in the intestine and mild colitis. Thus, PTPRS represents an evolutionarily conserved pDC-specific inhibitory receptor, and is required to prevent spontaneous IFN production and immune-mediated intestinal inflammation.


Figures

Figure 1
Figure 1. PTPRS Is Expressed Specifically in pDCs within the Human Immune System
(A) The binding of E2-2 to PTPRS locus in the human pDC cell line CAL-1 as determined by ChIP-seq. Shown are enrichment peaks of E2-2-associated chromatin (top track) and total chromatin input (bottom track) across the indicated loci. (B) The expression of PTPRS after E2-2 knockdown in the human pDC cell line Gen2.2. Cells were treated with Dox to induce the expression of shRNA specific for E2-2-encoding TCF4 gene or a scrambled control (Ctrl) shRNA, and the expression of TCF4 and PTPRS was measured by qRTPCR on days 2 and 4. Shown is the ratio of expression levels with or without Dox (means ± SD of triplicate PCR reactions); representative of two independent experiments with two TCF4-specific shRNAs. (C) The expression of PTPRS in primary human peripheral blood cells as determined by qRT-PCR (mean ± SD of triplicate reactions). CAL-1 cells were included as a positive control. (D and E) Cell surface expression of PTPRS on normal human PBMC. Cells were stained with control IgG or a polyclonal antibody to human PTPRS, followed by secondary fluorescent antibody and primary antibodies to cell surface markers. Shown is a representative staining profile of PBMC stained for pDC marker BDCA-2 (D) and PTPRS staining profiles in gated cell types including BDCA2+ CD123hi pDCs, T and B lymphocytes, monocytes (Mono), and granulocytes (Gran) (E). Similar results were obtained with PBMC from multiple donors and with commercial buffy coat samples.
Figure 2
Figure 2. PTPRS Inversely Correlates with and Inhibits the Activation of Human pDCs
(A) The dynamics of PTPRS expresion in primary human pDCs upon activation. Total PBMCs were cultured for 0–3 hr with CpG and stained for cell surface markers and PTPRS. Shown are staining profiles of gated pDCs at the indicated time points (representative of three experiments). (B) Intracellular distribution of PTPRS in human pDCs upon activation. The pDCs were enriched from PBMC, cultured with or without CpG for 4 hr, fixed, stained for PTPRS and analyzed by immunofluorescence microscopy. Representative of two experiments. (C) The expression of surface PTPRS in IFN-producing human pDCs. PBMCs were cultured with or without CpG overnight, stained for cell surface markers, fixed, and stained for intracellular IFN-α. Shown is the staining for PTPRS versus IFN-α in gated pDCs (representative of four experiments). (D) The effect of PTPRS crosslinking on IFN-α production by primary human pDCs. PBMCs were cultured in the presence of control IgG or anti-PTPRS antibody for 1 hr, activated with CpG for 16 hr, and stained for cell surface markers and intracellular IFN-α. Left panel shows representative staining profiles of gated pDCs with the fraction of IFN-α+ cells highlighted. Right panel shows the fractions of IFN-α+ cells within gated pDCs from six individual donors (mean values of two or three independent experiments per donor per condition). (E) The effect of PTPRS crosslinking on the production of TNF-α by human pDCs. PBMCs were activated and stained as above for cell surface markers and intracellular IFN-α and TNF-α. Shown are staining profiles of gated pDCs with the fraction of IFN-α+ TNF-α+ cells highlighted (representative of three individual donors). (F) The effect of PTPRS crosslinking on the activation of NF-κB in human pDCs. The pDCs were enriched from PBMC, cultured for 3 hr without (unstim.) or with CpG in the presence of control IgG or anti-PTPRS, fixed, stained for NF-κB p65 and DNA and scored for the degree of p65 nuclear translocation. Shown are representative immunofluorescence images of p65 staining and the percentage of pDCs with translocated p65 on the scale of 1 (full nuclear exclusion) to 4 (prominent nuclear staining), out of >200 cells in each group.
Figure 3
Figure 3. PTPRS Knockdown Enhances the Activation of a Human pDC Cell Line
(A) Western blot analysis of PTPRS and p38 (total and phosphorylated, p-p38) in the human pDC cell line Gen2.2 after stimulation with CpG. (B) Inducible knockdown of PTPRS in the Gen2.2 cell line. Gen2.2 cells were transduced with retroviral vectors encoding two independent shRNA for PTPRS (shRNA1 and shRNA2), and treated with Dox to induce shRNA expression. PTPRS expression was measured 2 days later by cell surface staining. (C) Western blot analysis of p-p38 in Gen2.2 cells that were treated with Dox for 48 hr to induce PTPRS knockdown and activated with CpG for 6 hr. (D) The expression of IFNB by Gen2.2 cells after Dox-inducible PTPRS knockdown. Cells carrying Dox-inducible shRNAs for PTPRS were treated with Dox for 48 hr, stimulated with type A CpG for 6 hr, and IFNB expression was determined by qRT-PCR (mean ± SD of triplicate reactions, representative of three experiments). (E) The expression of IFNB and IFN-inducible gene CXCL10 in Gen2.2 cells with Dox-induced PTPRS knockdown (shRNA1) at the indicated time points after stimulation with CpG (mean ± SD of triplicate PCRreactions; representative ofthreeexperiments).
Figure 4
Figure 4. Ptprs and Ptprf Are Specifically Coexpressed in Murine pDCs
(A) The expression of Ptprs and Ptprf in sorted murine immune cell types as determined by qRT-PCR (mean ± SD of triplicate reactions). Cells included BM granulocytes (Gran), BM and splenic pDCs, and splenic CD8+ and CD8 cDCs, macrophages, and lymphocytes. (B) The expression of Ptprf-GFP transgenic reporter in the indicated immune cell populations from the spleen. Shown are representative profiles of GFP fluorescence in the transgenic (Tg) and wild-type control (Ctrl) animals. (C) Cell surface expression of LAR phosphatases in murine pDCs. Splenocytes from mice with the indicated Ptprs and Ptprf genotypes were stained with control (Ctrl) or anti-PTPRS antibodies, followed by secondary fluorescent antibody and antibodies to cell surface markers. Shown are histograms and mean fluorescence intensities of gated pDCs and of CD8+ T cells as a negative control cell type. (D) The expression of LAR phosphatases in intestinal intraepithelial lymphocytes (IEL). IEL were isolated from Ptprf-GFP transgenic (Tg) or wild-type control (Ctrl) animals and stained for anti-PTPRS and surface markers. Shown are profiles of GFP fluorescence and PTPRS staining in the indicated gated populations. (E) The expression of LAR phosphatases in murine pDCs after activation. Total BM cells were incubated with medium only or CpG for 16 hr, stained for cell surface markers, fixed, and stained for intracellular IFN-α. Shown are staining intensities of the indicated proteins in gated pDCs.
Figure 5
Figure 5. Ptprs and Ptprf Inhibit the Activation of Murine pDCs
Murine HoxB8-FL cell line carrying the YFP knock-in reporter alleles of Ifnb (HoxB8-IfnbYFP) was differentiated into pDCs, activated with CpG in the indicated conditions, and analyzed for YFP expression. (A) Surface phenotype of the differentiated HoxB8-IfnbYFP cell clone used for the analysis. (B) The expression of IfnbYFP reporter and LAR phosphatases in HoxB8-IfnbYFP cells activated with CpG for the indicated time periods. (C) The effect of LAR phosphatases crosslinking on Ifnb induction in HoxB8-IfnbYFP cells. Shown are the fractions of YFP+ cells within HoxB8-IfnbYFP cells activated with CpG for 3–5 hr in the plates pre-coated with control IgG or anti-PTPRS (each symbol represents an independent experiment). (D) The effect of Fc receptor blockade on the inhibitory activity of anti-PTPRS. Shown are YFP expression profiles of HoxB8-IfnbYFP cells activated with CpG on plate-bound control IgG or anti-PTPRS without any additional treatments (none), or in the presence of blocking anti-FcR antibody (Fc Block) or normal goat serum. Alternatively, control IgG or anti-PTPRS were bound to the plate via Fc fragments by pre-coating with anti-goat IgG (Fc) secondary antibodies (anti-Fc bound). (E) The role of tyrosine phosphorylation in the Ifnb expression by HoxB8-IfnbYFP cells. Cells were activated with CpG on plates pre-coated with control IgG or anti-PTPRS, with or without the tyrosine phosphorylation inhibitor. (F) The effect of known LAR phosphatase ligands on Ifnb expression by HoxB8-IfnbYFP cells. Cells were activated with CpG on plates pre-coated with recombinant glypican or neurocan. (G) The effect of glypican on Ifnb expression within HoxB8-IfnbYFP cells activated with CpG for 3–5 hr (each symbol represents an independent experiment).
Figure 6
Figure 6. The Reduction of LAR Phosphatases Leads to pDC Hyperactivation and Colitis
(A) CpG-induced IFN-α production in the BM of mice reconstituted with control or Ptprs−/−Ptprf−/− (LAR-KO) hematopoietic cells. Total BM cells from individual control and LAR-KO chimeras were incubated with CpG for 24 hr, and IFN-α concentration in the supernatant was measured by ELISA. (B and C) The expression of IFN and IFN-inducible genes by pDCs from Ptprs+/−Ptprf−/− (LAR¾) mice. pDCs were sorted from the BM of control and LAR¾ mice, stimulated with CpG and examined by qRT-PCR (presented as mean ± SD of triplicate reactions). (B) shows the expression of Ifna after 24 hr after stimulation (representative of three independent experiments). (C) shows the expression of Ifnb and IFN-inducible genes by the same pDCs at the indicated time points after stimulation. (D) Concentrations of IFN-α and IFN-β in the sera of naive LAR¾ mice as measured by ELISA. (E) The fraction of CD45+ hematopoietic cells in the small intestinal intraepithelial lymphocyte preparations from individual control and LAR¾ mice. Each experiment involved one control and one LAR¾ animal; because of large variation between experiments, the results are presented as paired analysis. (F) The expression of IFN-α in the intestinal tissue of LAR¾ mice. Shown is the expression of Ifna in colon samples from individual control and LAR¾ mice as determined by qRT-PCR relative to a randomly chosen control sample. (G) Representative sections of the large intestines from LAR¾ mice and controls. Magnification, 2003; inset illustrates crypt abscess. (H) The frequency of intestinal inflammation as scored by histopathology, with statistical significance indicated. Numbers of analyzed animals were 13 (LAR¾ mice), 6 (LAR¾ controls), 10–11 (LAR-KO chimeras), and 7–9 (control chimeras).
Figure 7
Figure 7. The Deletion of LAR Phosphatases in Dendritic Cells Leads to pDC Hyperactivation and Colitis
Animals with conditional LAR phosphatase deletion (LAR-CKO, Ptprf−/− Ptprsflox/flox ItgaxCre), or controls (Ptprf+/+ Ptprsflox/flox ItgaxCre-negative in all panels except C) were examined. (A) Cytokine production by LAR-CKO pDCs. Total BM cells were cultured with CpG for 16 hr and stained for cell surface markers and intracellular cytokines. Shown are the histograms of IFN-α or TNF-α staining in gated B220+ SiglecH+ pDCs or in B220 non-pDC myeloid cells. The threshold of positive staining and the fraction of positive cells are indicated. Representative of three experiments. (B) Leukocyte infiltration in the intestinal LP of LAR-CKO and control mice. The number of total CD45+ leukocytes or CD3+ T cells recovered from the LP preparations of individual mice are shown. (C) Leukocyte and T cell infiltration in the intestinal LP from co-housed pairs of LAR-CKO and littermate controls (Ptprf+/− Ptprsflox/flox ItgaxCre-negative). (D) T cell infiltration in the intestine of LAR-CKO and control mice. Sections of the indicated intestinal compartments were stained for CD3 (brown) and counterstained with hematoxylin (blue).

References

    1. Aicher B, Lerch MM, Müller T, Schilling J, Ullrich A. Cellular redistribution of protein tyrosine phosphatases LAR and PTPsigma by inducible proteolytic processing. J. Cell Biol. 1997;138:681–696. - PMC - PubMed
    1. Balmelli C, Steiner E, Moulin H, Peduto N, Herrmann B, Summerfield A, McCullough K. Porcine circovirus type 2 DNA influences cytoskeleton rearrangements in plasmacytoid and monocyte-derived dendritic cells. Immunology. 2011;132:57–65. - PMC - PubMed
    1. Bar-On L, Zigmond E, Jung S. Management of gut inflammation through the manipulation of intestinal dendritic cells and macrophages? Semin. Immunol. 2011;23:58–64. - PubMed
    1. Baumgart DC, Metzke D, Guckelberger O, Pascher A, Grötzinger C, Przesdzing I, Dörffel Y, Schmitz J, Thomas S. Aberrant plasmacytoid dendritic cell distribution and function in patients with Crohn's disease and ulcerative colitis. Clin. Exp. Immunol. 2011;166:46–54. - PMC - PubMed
    1. Blasius A, Vermi W, Krug A, Facchetti F, Cella M, Colonna M. A cell-surface molecule selectively expressed on murine natural inter-feron-producing cells that blocks secretion of interferon-alpha. Blood. 2004;103:4201–4206. - PubMed

Publication types

Substances