. 2015 Sep 17;126(12):1483-93.
doi: 10.1182/blood-2013-12-544445. Epub 2015 Jul 31.

Platelets induce apoptosis via membrane-bound FasL

Affiliations

Platelets induce apoptosis via membrane-bound FasL

Rebecca I Schleicher et al. Blood. .

Erratum in

Abstract

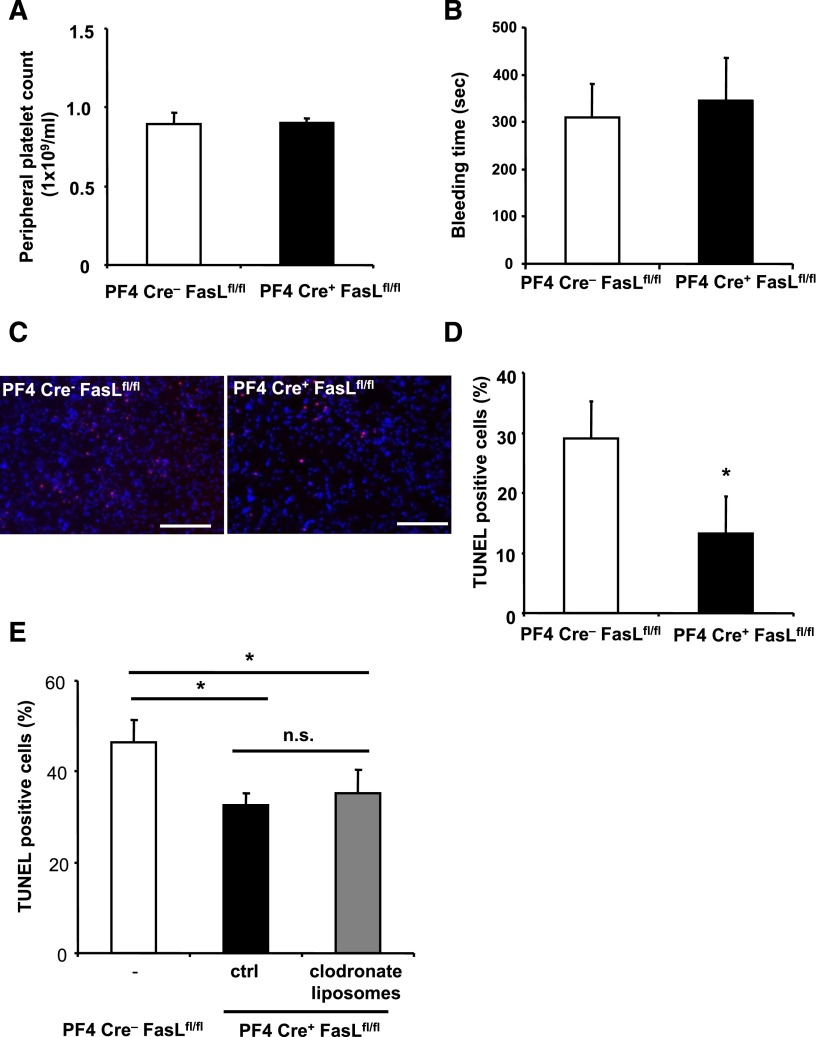
After tissue injury, both wound sealing and apoptosis contribute to restoration of tissue integrity and functionality. Although the role of platelets (PLTs) for wound closure and induction of regenerative processes is well established, the knowledge about their contribution to apoptosis is incomplete. Here, we show that PLTs present the death receptor Fas ligand (FasL) on their surface after activation. Activated PLTs as well as the isolated membrane fraction of activated PLTs but not of resting PLTs induced apoptosis in a dose-dependent manner in primary murine neuronal cells, human neuroblastoma cells, and mouse embryonic fibroblasts. Membrane protein from PLTs lacking membrane-bound FasL (FasL(△m/△m)) failed to induce apoptosis. Bax/Bak-mediated mitochondrial apoptosis signaling in target cells was not required for PLT-induced cell death, but increased the apoptotic response to PLT-induced Fas signaling. In vivo, PLT depletion significantly reduced apoptosis in a stroke model and an inflammation-independent model of N-methyl-d-aspartic acid-induced retinal apoptosis. Furthermore, experiments using PLT-specific PF4Cre(+) FasL(fl/fl) mice demonstrated a role of PLT-derived FasL for tissue apoptosis. Because apoptosis secondary to injury prevents inflammation, our findings describe a novel mechanism on how PLTs contribute to tissue homeostasis.


Figures

Figure 1
Figure 1
PLT depletion reduces apoptosis in a murine stroke model in vivo. (A-E) Stroke was induced in C57BL/6 mice by tMCAO for 60 minutes. (A-B) Ischemic brain tissues were co-stained for PLT GPIbα (red), neuronal cells (NeuN, blue), and endothelial cells (CD31, green). Nuclei were stained using DAPI (displayed in white using Leica Confocal software version 2.61). Scale bar, 20 µm. (A) Shows representative images. (B) For quantification, PLTs outside of vessels were counted in a blinded fashion using fluorescence microscopy in healthy and ischemic brain tissue. Data are mean ± SEM and show the percentage of total PLTs per section (n = 6, 3 non-consecutive sections per animal were analyzed). (C) Identification of early (Annexin V+, PI) and late (Annexin V+, PI+) apoptosis in CD45.2 nonleukocytes that complex with CD41+ PLTs in stroke tissue and the contralateral control hemisphere (upper panel). Percentage of CD41+ PLT complexes with apoptotic nonleukocytes in the stroke hemisphere relative to the corresponding contralateral hemisphere was calculated (n = 4). Results are presented as mean ± SEM, *P < .05 (left, lower panel). FMO staining controls document staining specificity and gating strategy (right, lower panel). (D-E) Prior to stroke induction, animals were treated with either control serum (ctrl) or PLT-depleting serum (PLT depletion) resulting in more than 90% of PLT depletion (supplemental Figure 1). (D) Shows representative images of stained tissue sections from a control serum or PLT-depleting serum-treated mouse after induction of stroke. Nuclei were stained with DAPI (blue) and TUNEL-positive cells are depicted in red. Scale bar, 100 µM. (E) Quantification of apoptotic cells upon injection of control serum or PLT-depleting serum. For quantification, apoptotic cells were counted in a blinded fashion using fluorescence microscopy. Data are mean ± SEM and show the percentage of TUNEL-positive cells of total cell number per section (n = 6). *P < .05 vs control treated animals. FMO, fluorescence minus one.
Figure 2
Figure 2
PLT depletion reduces apoptosis in a retinal model with low levels of inflammation, whereas inhibition of GPIIb-IIIa does not affect tissue apoptosis. (A-B) Mice were treated with control serum (ctrl) or PLT-depleting serum (PLT depletion). Subsequently, neuronal apoptosis was induced by intravitreal injection of NMDA. In this model of tissue apoptosis, levels of tissue inflammation are negligible. In retinal sections, TUNEL staining was performed and sections were analyzed in a blinded fashion using immunofluorescence microscopy. Eight non-consecutive sections were analyzed per animal. (A) Shows representative images. (B) Data are mean ± SEM and show the number of TUNEL-positive cells per area (n = 8). *P < .05 vs control treated animals. Scale bar, 100 µm. (C) Stroke was induced in C57BL/6 mice by tMCAO for 60 minutes. Animals were treated with a blocking anti–GPIIb-IIIa F(ab) 1 hour prior to stroke induction. Data are mean ± SEM and show the percentage of TUNEL-positive cells of total cell number per section (n = 5, 3 non-consecutive sections per animal were counted in a blinded fashion). No significant difference was observed between groups. INL, inner nuclear layer; ONL, outer nuclear layer; RGC, retinal ganglion cell.
Figure 3
Figure 3
PLTs induce apoptosis in a dose-dependent manner in in vitro grown neuroblastoma cells. (A) Isolated human PLTs were stimulated with ADP, fixed with PFA to exclude PLT-derived signal, and incubated with SH-SY5Y neuroblastoma target cells. As positive control, cells were treated with 1 µM STS. After 6 hours, caspase activity was measured and calculated as mean ± SEM (n = 6). *P < .05 vs control. Results are expressed as percentage of buffer-treated control. (B) LDH activity was measured in the supernatant of cultured SH-SY5Y cells after application of various dilutions (4 × 10⁻⁴; 4.5 × 10⁻⁴; 5 × 10⁻⁴) of isolated membrane protein and soluble fractions of buffer- (−) or ADP-stimulated (+) human PLTs for 6 hours. Data were normalized to the total LDH level from the same amount of untreated and lysed cells. Data represent mean ± SEM (n = 9) and are shown as percentage of total cellular LDH levels of untreated cells. *P < .05 vs corresponding soluble fraction or membrane fractions of resting PLTs. (C) Caspase 3/7 activity kinetics were measured in SH-SY5Y cells incubated with various dilutions (4 × 10⁻⁴; 4.5 × 10⁻⁴; 5 × 10⁻⁴) of the isolated membrane protein and soluble fractions of ADP-stimulated human PLTs for 6 hours. Data were normalized to the corresponding samples from buffer-stimulated PLTs (control). Data represent mean ± SEM (n = 12) and are shown as percentage of control. *P < .05 vs corresponding soluble fraction. (D) Primary murine neuronal cells were incubated with buffer (ctrl) or with membrane proteins of ADP-activated murine PLTs (0.5 × 10⁸ or 2.5 × 10⁸ PLTs). To analyze cell death, cultures were co-stained for NeuN and active caspase 3. For quantification, staining was analyzed in a blinded fashion by fluorescence microscopy. Data are mean ± SEM (n = 5) and are shown as percentage of total cell number per section. *P < .05 vs control. Scale bar, 20 µm.
Figure 4
Figure 4
PLTs express FasL. (A) Expression levels of death ligands FasL and TRAIL in resting or ADP-activated murine PLTs and MEFs analyzed by western blot. Loading equivalency was assessed by Tom20 staining. (B) Human whole blood was stimulated with ADP (activated) or buffer (resting), fixed with PFA, and analyzed by flow cytometry. PLTs were gated by forward and side light scatter characteristics and analyzed for FasL expression using a PE-coupled FasL Ab. Data are mean ± SEM and are shown as percentage of control and IgG control represents the 100% control (n = 5). *P < .05 vs control. (C) Murine PLTs were stimulated with ADP and analyzed for surface expression of FasL by flow cytometry. Data are mean ± SEM and are shown as percentage of control. Resting PLTs represent the 100% control (n = 7). *P < .05 vs control. (D) PLTs were co-stained for the α-granular marker CD62P (green) and FasL (red). Staining was analyzed by confocal fluorescence microscopy. Scale bar, 5 µM.
Figure 5
Figure 5
PLT membrane protein induces apoptosis via membrane-bound FasL. (A) MEFs were incubated with various dilutions (4 × 10⁻⁴; 4.5 × 10⁻⁴; 5 × 10⁻⁴) of membrane proteins (membrane fraction) of buffer- or ADP-stimulated PLTs from WT mice or FasL△m/△m mice (lacking membrane-bound FasL only) for 6 hours. Isolated soluble proteins (soluble fraction) of buffer- or ADP-stimulated PLTs from WT mice or FasL△m/△m mice were incubated in a dilution of 5 × 10⁻⁴ of the protein sample. Subsequently, LDH activity was measured. Data represent mean ± SEM (n = 9) and are shown as percentage of total cellular LDH levels of untreated cells. *P < .05 vs FasL△m/△m, soluble- and membrane-fraction of resting WT PLTs. (B) Caspase 3/7 activity kinetics were measured in MEFs incubated with various dilutions (4 × 10⁻⁴; 4.5 × 10⁻⁴; 5 × 10⁻⁴) of the isolated membrane protein fraction of ADP-stimulated PLTs from WT or FasL△m/△m mice for 6 hours. Isolated soluble proteins (soluble fraction) were incubated in a dilution to 5 × 10⁻⁴ of the protein sample. Data were normalized to the corresponding samples from resting PLTs. Data are shown as percentage of control and represent mean ± SEM (n = 6). *P < .05 vs FasL△m/△m or soluble fractions. (C) LDH activity was measured after 6 hours in the supernatant of mitochondrial apoptosis-incompetent Bax/Bak DKO MEFs incubated with various dilutions (4 × 10⁻⁴; 4.5 × 10⁻⁴; 5 × 10⁻⁴) of membrane protein (membrane fraction) of resting or ADP-stimulated PLTs from WT or FasL△m/△m mice. Soluble proteins (soluble fraction) were incubated in a dilution to 5 × 10⁻⁴ of the isolated proteins. Data represent mean ± SEM (n = 6) and are shown as percentage of total cellular LDH levels of untreated cells. *P < .05 vs FasL△m/△m, soluble fraction or membrane fraction of resting WT PLTs. (D) SH-SY5Y cells transfected with GFP-Bax were incubated with resting or ADP-stimulated and PFA-fixed PLTs for 6 hours. Co-localization of GFP-Bax fluorescence (green) with mitochondrial Tom20 staining (red) is shown in yellow in the merged panel. Bax activation was detected with the conformation-specific anti-Bax Ab 6A7. Co-localization of active Bax and mitochondrial Bax is shown in cyan and white, respectively, in the merged panel. Bars, 10 µm.
Figure 6
Figure 6
PLT-derived FasL contributes to tissue apoptosis in vivo. (A-E) PF4-Cre+ FasLfl/fl mice were generated and stroke was induced by tMCAO. PF4-Cre FasLfl/fl mice served as control. (A-B) We observed no difference in peripheral PLT counts and bleeding time between Cre littermates and PF4-Cre+ FasLfl/fl mice. (C-D) Apoptosis was quantified in brain sections using TUNEL staining. Neuronal apoptosis is presented as the percentage of TUNEL positive cells (red) of total cell number per section. Nuclei were stained using DAPI (blue). Data are mean ± SEM (n = 6, 5 non-consecutive sections per animal were analyzed). *P < .05 vs control animals. (C) Depicts representative images of the analyzed sections. (E) PF4-Cre+ FasLfl/fl mice were injected with control liposomes or clodronate liposomes to deplete macrophages before stroke induction, and apoptosis was assessed within the brain tissue by TUNEL staining. Furthermore, PF4-Cre FasLfl/fl mice were used as control. Data are mean ± SEM (n = 6, 3 non-consecutive sections per animal were analyzed). *P < .05 for PF4-Cre+ animals treated with clodronate liposomes or control liposomes in comparison with PF4-Cre control animals. n.s., no significance.

Similar articles

Cited by

References

    1. Wagner DD, Frenette PS. The vessel wall and its interactions. Blood. 2008;111(11):5271–5281. - PMC - PubMed
    1. Varga-Szabo D, Pleines I, Nieswandt B. Cell adhesion mechanisms in platelets. Arterioscler Thromb Vasc Biol. 2008;28(3):403–412. - PubMed
    1. Nachman RL, Rafii S. Platelets, petechiae, and preservation of the vascular wall. N Engl J Med. 2008;359(12):1261–1270. - PMC - PubMed
    1. Ruggeri ZM, Mendolicchio GL. Adhesion mechanisms in platelet function. Circ Res. 2007;100(12):1673–1685. - PubMed
    1. Gawaz M, Langer H, May AE. Platelets in inflammation and atherogenesis. J Clin Invest. 2005;115(12):3378–3384. - PMC - PubMed

Publication types

Substances