
Identification of Genetic Factors that Modify Clinical Onset of Huntington's Disease

Genetic Modifiers of Huntington’s Disease (GeM-HD) Consortium. Cell. .

Abstract

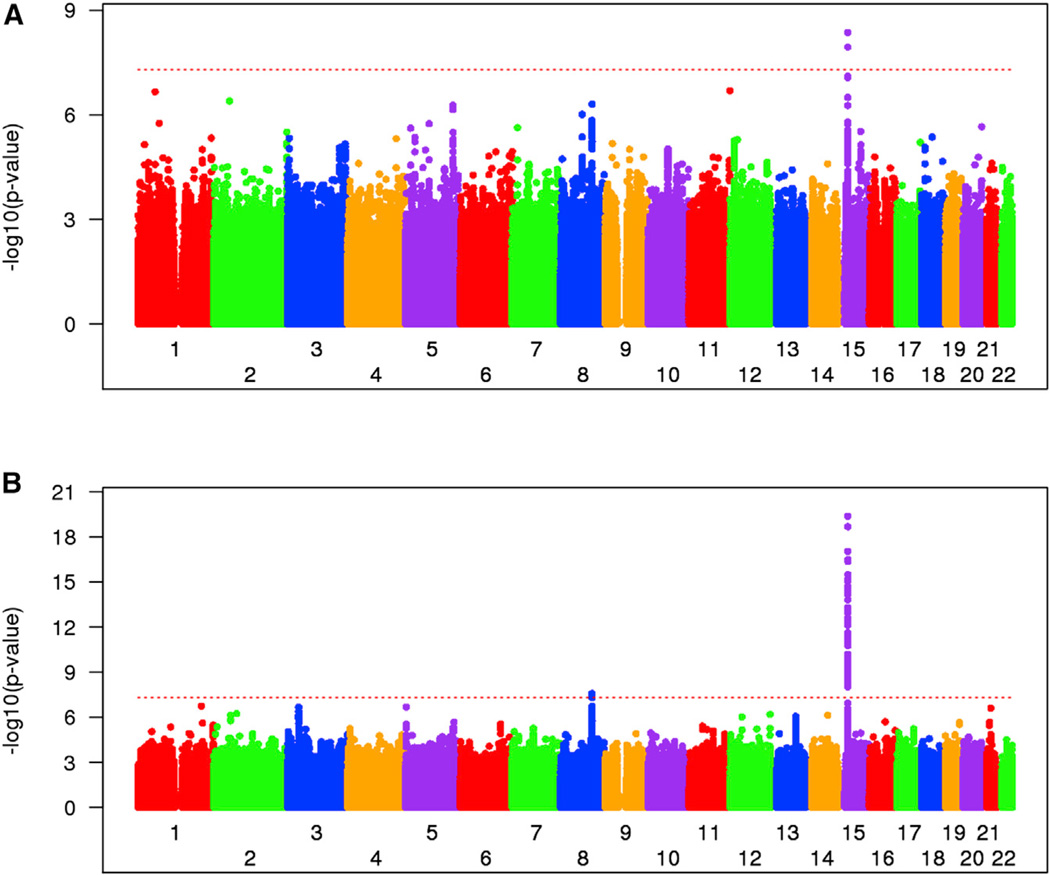
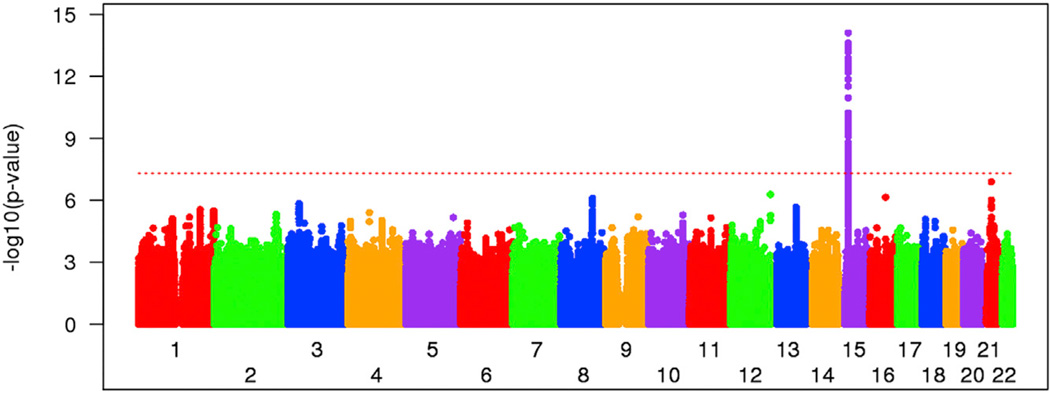
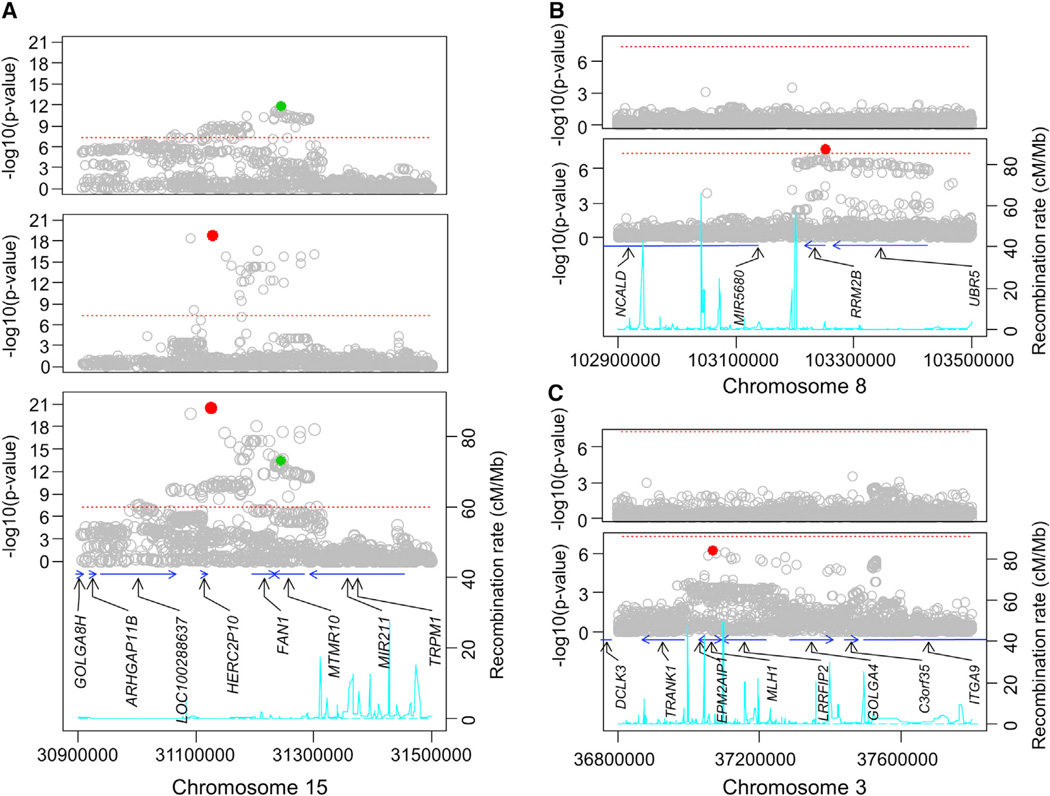
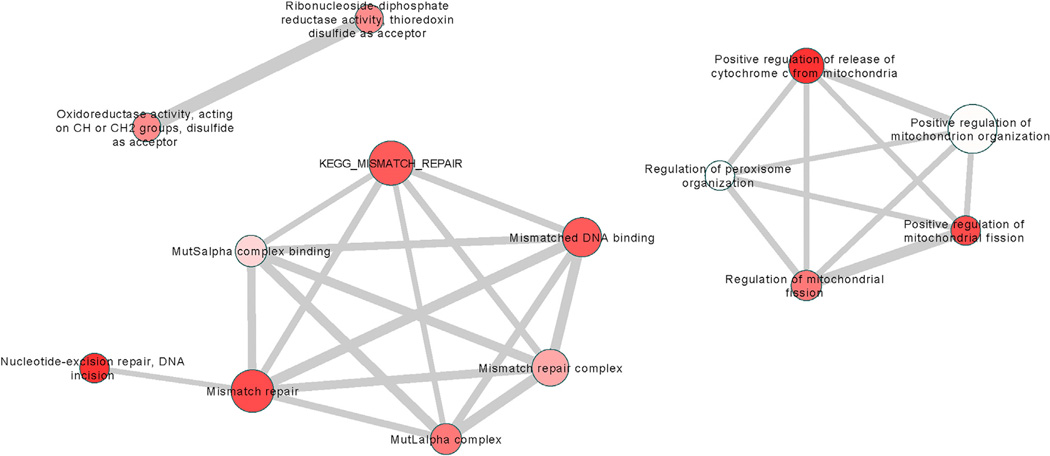
As a Mendelian neurodegenerative disorder, the genetic risk of Huntington's disease (HD) is conferred entirely by an HTT CAG repeat expansion whose length is the primary determinant of the rate of pathogenesis leading to disease onset. To investigate the pathogenic process that precedes disease, we used genome-wide association (GWA) analysis to identify loci harboring genetic variations that alter the age at neurological onset of HD. A chromosome 15 locus displays two independent effects that accelerate or delay onset by 6.1 years and 1.4 years, respectively, whereas a chromosome 8 locus hastens onset by 1.6 years. Association at MLH1 and pathway analysis of the full GWA results support a role for DNA handling and repair mechanisms in altering the course of HD. Our findings demonstrate that HD disease modification in humans occurs in nature and offer a genetic route to identifying in-human validated therapeutic targets in this and other Mendelian disorders.


Figures

Figure 1
Figure 1. Genome-wide Association Analysis of Residual Age at Motor Onset
(A) Manhattan plot of combined GWA1+GWA2 analysis yielding a locus with genome-wide significance on chr15. GWA1 and GWA2 data were combined and tested for association with residual age at onset. Significance of SNPs (−log10[p value], y axis) is plotted against genomic location (x axis). The QQ plot (Figure S1C) did not reveal significant statistical inflation evidenced by an inflation factor of 1.014. (B) Manhattan plot of meta-analysis of GWA1+2 and 3 showing genome-wide significant peaks at chr15 and chr8 and near-significant on chr3, along with other trails. Association analysis was initially performed independently on GWA3 data (not shown), and then a meta-analysis was performed to summarize the overall association findings of the GWA1+GWA2 and GWA3 analyses. The overall inflation factor of 1.009 suggests the absence of statistical inflation in this analysis (Figure S1D). The red dotted lines in (A) and (B) indicate the genome-wide significance level (p value, 5 × 10⁻⁸). The GeM-HD Group has developed a web portal through which interested investigators can access the genome-wide SNP association data by SNP, gene, or genomic location of interest. This can be accessed through the HDinHD portal (https://www.hdinhd.org/). Original data will be made available on request. Please direct inquiries to info@chdifoundation.org with the words “GWAS data” in the subject line. See also Figure S1 and Table S1.
Figure 2
Figure 2. Dichotomous Association Analysis in Extremes of Age at Motor Onset
Association analysis was carried out to compare SNP allele frequencies between the 20% extremes of residual age at motor onset, showing that the modifier effect on chr15 is captured by the allele frequency distribution in addition to quantitative analysis. See also Table S2.
Figure 3
Figure 3. Conditional Association Analysis at Top Loci
(A) Chromosome 15 locus. Bottom panel: The single SNP association analysis of the combined dataset using a fixed-effect model is shown above the recombination rate (cyan line), based upon HapMap samples, and the largest transcript for each annotated gene in the region (blue arrows). The red and green circles represent the most significant independent SNPs that emerged from the conditional analyses shown in the middle and top panels. Middle panel: Single SNP association analysis conditioned by rs2140734 (green in bottom and top panels) revealing a group of SNPs that remain significant after removing the effect associated with rs2140734. Top panel: Single SNP association analysis conditioned by rs146353869 (red in bottom and middle panels) revealing a group of SNPs that remain significant after removing the effect associated with rs146353869. (B) Chromosome 8 locus. Bottom panel: The chr8 locus single SNP association analysis of the combined dataset using a fixed-effect model is shown above the recombination rate (cyan line), based upon HapMap samples, and the largest transcript for each annotated gene in the region (blue arrows). The red circle represents the most significant SNP that was used in the conditional analysis. Top panel: Single SNP association analysis conditioned by rs1037699 (red in bottom panel) revealing that all SNPs that showed association in the original association analysis were no longer significant after removing the effect associated with rs1037699. (C) Chromosome 3 locus. Bottom panel: The chr3 locus single SNP association analysis of the combined dataset using a fixed-effect model is shown above the recombination rate (cyan line), based upon HapMap samples, and the largest transcript for each annotated gene in the region (blue arrows). The red circle represents the most significant SNP that was used in the conditional analysis. Top panel: Single SNP association analysis conditioned by rs144287831 (red in bottom panel) revealing that all SNPs that showed association in the original association analysis were no longer significant after removing the effect associated with rs144287831.
Figure 4
Figure 4. Fourteen Significant Pathways (q < 0.05) from the Main Setscreen Analysis Clustered by Gene Membership
Thickness of line connecting two pathways is proportional to the number of genes shared between them. The size of the node is proportional to the number of SNPs. The intensity of shading is inversely proportional to the q value; deep shades of red have low q values, and pale shading is close to the 5% threshold. Pathways were assigned to clusters as follows: For each pair of pathways, an overlap measure K was defined as the number of genes common to both pathways divided by the number of genes in the smaller pathway. A pathway was assigned to a cluster if the average K between it and the pathways already in the cluster was greater than 0.4. If it was not possible to assign a pathway to an existing cluster, a new cluster was started. This procedure was carried out recursively, in descending order of enrichment significance. See also Tables S3, S4, and S5.

References

    1. Antonacci F, Dennis MY, Huddleston J, Sudmant PH, Steinberg KM, Rosenfeld JA, Miroballo M, Graves TA, Vives L, Malig M, et al. Palindromic GOLGA8 core duplicons promote chromosome 15q13.3 microdeletion and evolutionary instability. Nat. Genet. 2014;46:1293–1302. - PMC - PubMed
    1. Aronin N, DiFiglia M. Huntingtin-lowering strategies in Huntington’s disease: antisense oligonucleotides, small RNAs, and gene editing. Mov. Disord. 2014;29:1455–1461. - PubMed
    1. Bourdon A, Minai L, Serre V, Jais JP, Sarzi E, Aubert S, Chrétien D, de Lonlay P, Paquis-Flucklinger V, Arakawa H, et al. Mutation of RRM2B, encoding p53-controlled ribonucleotide reductase (p53R2), causes severe mitochondrial DNA depletion. Nat. Genet. 2007;39:776–780. - PubMed
    1. Brown MB. A method for combining non-independent, one-sided tests of significance. Biometrics. 1975;31:978–992.
    1. Chaudhury I, Stroik DR, Sobeck A. FANCD2-controlled chromatin access of the Fanconi-associated nuclease FAN1 is crucial for the recovery of stalled replication forks. Mol. Cell. Biol. 2014;34:3939–3954. - PMC - PubMed

Publication types