. 2015 Sep:258:58-64.
doi: 10.1016/j.jmr.2015.06.011. Epub 2015 Jul 17.

Field-stepped direct detection electron paramagnetic resonance

Affiliations

Field-stepped direct detection electron paramagnetic resonance

Zhelin Yu et al. J Magn Reson. 2015 Sep.

Abstract

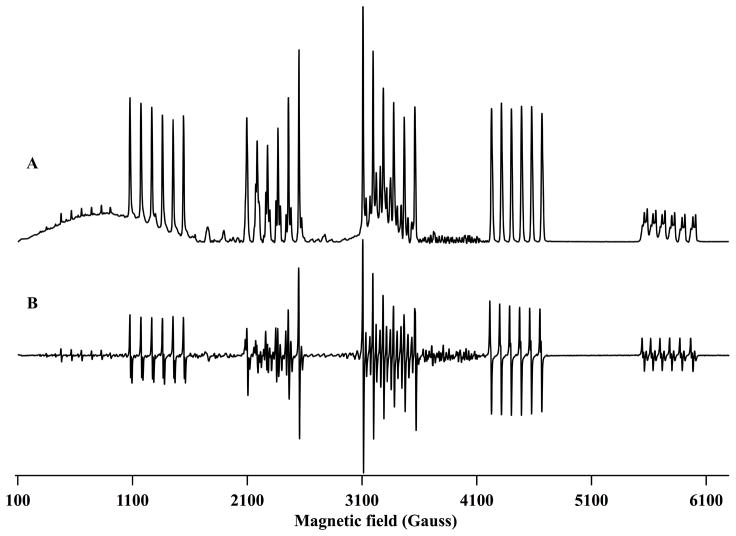
The widest scan that had been demonstrated previously for rapid scan EPR was a 155G sinusoidal scan. As the scan width increases, the voltage requirement across the resonating capacitor and scan coils increases dramatically and the background signal induced by the rapidly changing field increases. An alternate approach is needed to achieve wider scans. A field-stepped direct detection EPR method that is based on rapid-scan technology is now reported, and scan widths up to 6200G have been demonstrated. A linear scan frequency of 5.12kHz was generated with the scan driver described previously. The field was stepped at intervals of 0.01 to 1G, depending on the linewidths in the spectra. At each field data for triangular scans with widths up to 11.5G were acquired. Data from the triangular scans were combined by matching DC offsets for overlapping regions of successive scans. This approach has the following advantages relative to CW, several of which are similar to the advantages of rapid scan. (i) In CW if the modulation amplitude is too large, the signal is broadened. In direct detection field modulation is not used. (ii) In CW the small modulation amplitude detects only a small fraction of the signal amplitude. In direct detection each scan detects a larger fraction of the signal, which improves the signal-to-noise ratio. (iii) If the scan rate is fast enough to cause rapid scan oscillations, the slow scan spectrum can be recovered by deconvolution after the combination of segments. (iv) The data are acquired with quadrature detection, which permits phase correction in the post processing. (v) In the direct detection method the signal typically is oversampled in the field direction. The number of points to be averaged, thereby improving the signal-to-noise ratio, is determined in post processing based on the desired field resolution. A degased lithium phthalocyanine sample was used to demonstrate that the linear deconvolution procedure can be employed with field-stepped direct detection EPR signals. Field-stepped direct detection EPR spectra were obtained for Cu(2+) doped in Ni(diethyldithiocarbamate)2, Cu(2+) doped in Zn tetratolylporphyrin, perdeuterated tempone in sucrose octaacetate, vanadyl ion doped in a parasubstituted Zn tetratolylporphyrin, Mn(2+) impurity in CaO, and an oriented crystal of Mn(2+) doped in Mg(acetylacetonate)2(H2O)2.

Keywords: Direct detection; Metalloporphyrin; Mn(2+); Rapid scan.


Figures

Figure 1
Figure 1
Block diagram of post processing procedure for spectral reconstruction in field-stepped direct detection, using typical parameters. For example, data could be acquired at 151 field positions in 1.0 G increments over 150 G. Each scan is 11.5 G wide and the linear scan frequency is 5.12 kHz, which corresponds to a scan rate of 118 kG/s. From each of the scans the central 80 % is selected. The DC offset between scans is calculated by comparing signal intensity at the comparable fields in overlapping segments of successive scans and this correction is applied prior to combining the spectra.
Figure 2
Figure 2
Example of the spectral reconstruction procedure for LiPc. A) Spectrum numbers 1, 101, and 201 from the set of 201 spectral steps, showing the central 80%. B) Alignment of these three scans after shifting in time to correct for the stepping of the field. C) LiPc spectra obtained by combining contributions from all 201 spectra, after correction for DC offset. For the LiPc spectra rapid scan oscillations were observed in the signal. D) The slow-scan absorption spectrum was reconstructed by deconvolution.
Figure 3
Figure 3
A) Spectrum of LiPc obtained by field-stepped direct detection. B) The first derivative of the spectrum in part A (black, solid) overlaid on the CW spectrum (red, dashed) obtained with a modulation amplitude of 3.6 mG and 2 mG field resolution. The B1 was 3.3 mG for both spectra.
Figure 4
Figure 4
Example of the DC offset correction. A) Spectrum of Cu2+ in Ni(Et2dtc)2 obtained by field-stepped direct detection in 701 steps over 700 G. The region that is expanded in parts B – D is marked with a box. B) Expansion of region between 3374.4 and 3387.6 G, obtained by averaging the segments that contribute in the region, after DC offset correction. C) Superposition of 5 successive segments that contribute to the spectrum between 3374.4 and 3387.6 G, after correction for DC offset. Each segment is shown in a different color. D) Five successive segments that contribute to the spectrum between 3374.4 and 3387.6 G, before correction for DC offset. The vertical lines denote the beginning and end of a particular segment. The y axis scales are the same for parts B to D.
Figure 5
Figure 5
Rapid scan background signals and DC offset correction for data acquired with a scan frequency of 5.12 kHz and B1 = 174 mG. A) Sampling of 8 of the 22 segments that contribute in the region 3410 to 3441 G for an empty EPR tube. B) Signal obtained by summing all 22 segments without DC offset correction. C) Signal obtained by summing the 22 segments after DC offset correction. D) Signal obtained by subtraction of a linear fit to the data in part C.
Figure 6
Figure 6
A) Spectrum of Cu2+ in Ni(Et2dtc)2 obtained by field-stepped direct detection in 701 steps over 700 G. Each scan was 11.5 G wide and the linear scan frequency was 5.12 kHz, which corresponds to a scan rate of 118 kG/s. B) The first derivative of the spectrum in part A, and C) the CW spectrum obtained with a modulation amplitude of 1.5 G with 0.5 G field resolution. The B1 was 17.4 mG for both spectra.
Figure 7
Figure 7
A) Spectrum of Cu2+ in ZnTTP obtained by field-stepped direct detection in 1201 steps over 1200 G. Each scan was 11.5 G wide and the linear scan frequency was 5.12 kHz, which corresponds to a scan rate of 118 kG/s. B) The first derivative of spectrum in part A, and C) the CW spectrum obtained with a modulation amplitude of 1.2 G with 0.5 G field resolution. The insets below traces B and C show the parallel regions of the spectra with the y axis scale expanded by a factor of 10. The B1 was 17.4 mG for both field-stepped and CW spectra.
Figure 8
Figure 8
A) Spectrum of nitroxide PDT in sucrose octaacetate obtained by field-stepped direct detection in 151 steps over 150 G. Each scan was 11.5 G wide and the linear scan frequency was 5.12 kHz, which corresponds to a scan rate of 118 kG/s. B) The first derivative of the spectrum in part A, and C) CW spectrum obtained with a modulation amplitude of 0.6 G and 0.1 G field resolution. The B1 was 17.4 mG for both spectra.
Figure 9
Figure 9
A) Spectrum of VO2+ in Zn(TTP-COOH) obtained by field-stepped direct detection in 1501 steps over 1500 G. Each scan was 11.5 G wide and the linear scan frequency was 5.12 kHz, which corresponds to a scan rate of 118 kG/s. B) The first derivative of spectrum in part A, and C) the CW spectrum obtained with a modulation amplitude of 1.1 G with 0.5 G field resolution. The B1 was 17.4 mG for both spectra.
Figure 10
Figure 10
A) Spectrum of Mn2+ in CaO obtained by field-stepped direct detection in 1201 steps over 600 G. Each scan was 11.5 G wide and the linear scan frequency was 5.12 kHz, which corresponds to a scan rate of 118 kG/s. B) The first derivative of the spectrum in part A, and C) the CW spectrum obtained with a modulation amplitude of 0.15 G and 0.1 G field resolution. The insets below trace B and above trace C show the forbidden transitions with y axis scales expanded by a factor of 20. The B1 was 17.4 mG for both spectra.
Figure 11
Figure 11
A) Spectrum of an oriented crystal of Mn2+ in Mg(acac)2(H2O)2 obtained by field-stepped direct detection in 6201 steps over 6200 G. B) CW spectrum obtained with a modulation amplitude of 1.1 G and field resolution of 1.0 G. The B1 was 174 mG for both spectra.

References

    1. Eaton SS, Quine RW, Tseitlin M, Mitchell DG, Rinard GA, Eaton GR. Rapid Scan Electron Paramagnetic Resonance. In: Misra SK, editor. Multifrequency Electron Paramagnetic Resonance: Data and Techniques. Wiley; 2014. pp. 3–67.
    1. Mitchell DG, Tseitlin M, Quine RW, Meyer V, Newton ME, Schnegg A, George B, Eaton SS, Eaton GR. X-Band Rapid-scan EPR of Samples with Long Electron Relaxation Times: A Comparison of Continuous Wave, Pulse, and Rapid-scan EPR. Mol Phys. 2013;111:2664–2673.
    1. Tseitlin M, Yu Z, Quine RW, Rinard GA, Eaton SS, Eaton GR. Digitally generated excitation and near-baseband quadrature detection of rapid scan EPR signals. J Magn Reson. 2014;249:126–134. - PMC - PubMed
    1. Joshi JP, Ballard JR, Rinard GA, Quine RW, Eaton SS, Eaton GR. Rapid-Scan EPR with Triangular Scans and Fourier Deconvolution to Recover the Slow-Scan Spectrum. J Magn Reson. 2005;175:44–51. - PubMed
    1. Tseitlin M, Rinard GA, Quine RW, Eaton SS, Eaton GR. Deconvolution of Sinusoidal Rapid EPR Scans. J Magn Reson. 2011;208:279–283. - PMC - PubMed

Publication types

MeSH terms

LinkOut - more resources